Dogecoin (DOGE) Tries To Bounce – But Resistance Barrier Keeps Rally In Check


Dogecoin started a fresh decline below the $0.2550 zone against the US Dollar. DOGE is now correcting some losses and might face hurdles near $0.2550.
- DOGE price started a fresh decline below the $0.250 level.
- The price is trading below the $0.2540 level and the 100-hourly simple moving average.
- There is a bearish trend line forming with resistance at $0.2540 on the hourly chart of the DOGE/USD pair (data source from Kraken).
- The price could extend losses if it stays below $0.2550 and $0.260.
Dogecoin Price Attempts Recovery
Dogecoin price started a fresh decline after it closed below $0.260, like Bitcoin and Ethereum . DOGE declined below the $0.2550 and $0.2540 support levels.
The price even traded below $0.2420. A low was formed near $0.2413, and the price recently attempted a recovery wave. There was a move above the 50% Fib retracement level of the downward move from the $0.2609 swing high to the $0.213 low.
However, the bears were active near the $0.2550 resistance and the Fib retracement level of the downward move from the $0.2609 swing high to the $0.213 low. Besides, there is a bearish trend line forming with resistance at $0.2540 on the hourly chart of the DOGE/USD pair.
Dogecoin price is now trading below the $0.2550 level and the 100-hourly simple moving average. If there is a recovery wave, immediate resistance on the upside is near the $0.2540 level. The first major resistance for the bulls could be near the $0.2550 level.
The next major resistance is near the $0.260 level. A close above the $0.260 resistance might send the price toward the $0.2780 resistance. Any more gains might send the price toward the $0.2840 level. The next major stop for the bulls might be $0.2920.
More Losses In DOGE?
If DOGE’s price fails to climb above the $0.2540 level, it could continue to move down. Initial support on the downside is near the $0.2475 level. The next major support is near the $0.240 level.
The main support sits at $0.2320. If there is a downside break below the $0.2320 support, the price could decline further. In the stated case, the price might slide toward the $0.2120 level or even $0.2050 in the near term.
Technical Indicators
Hourly MACD – The MACD for DOGE/USD is now gaining momentum in the bullish zone.
Hourly RSI (Relative Strength Index) – The RSI for DOGE/USD is now above the 50 level.
Major Support Levels – $0.2475 and $0.2400.
Major Resistance Levels – $0.2540 and $0.2600.
Is The XRP Bottom In? Pundit Claims ‘Sellers Are Exhausted’
Crypto commentator Zach Rector argues that XRP’s months-long malaise is nearing a turning point, con...
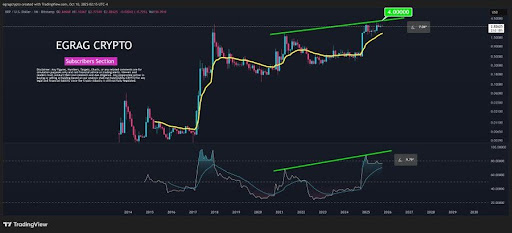
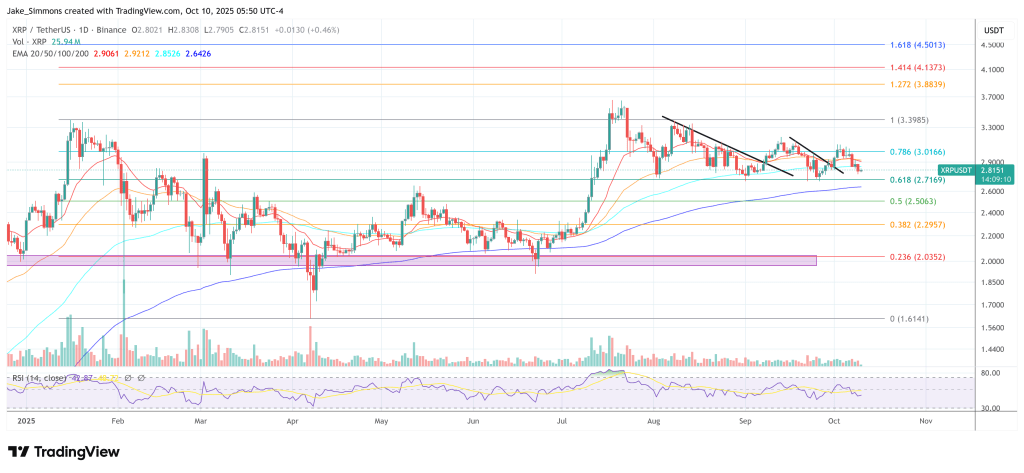
XRP Bullish Symphony: Price And RSI Align For A Run Toward $4
XRP is showing signs of a powerful bullish resurgence as both price action and momentum indicators m...

Digital Assets Demand Rising: 1 In 2 Institutions To Increase Holdings Within A Year
According to State Street’s 2025 global research, big investors are moving past trial runs and makin...