Bitcoin Bounces Back – Could Current Recovery Trigger Fresh Bullish Momentum?


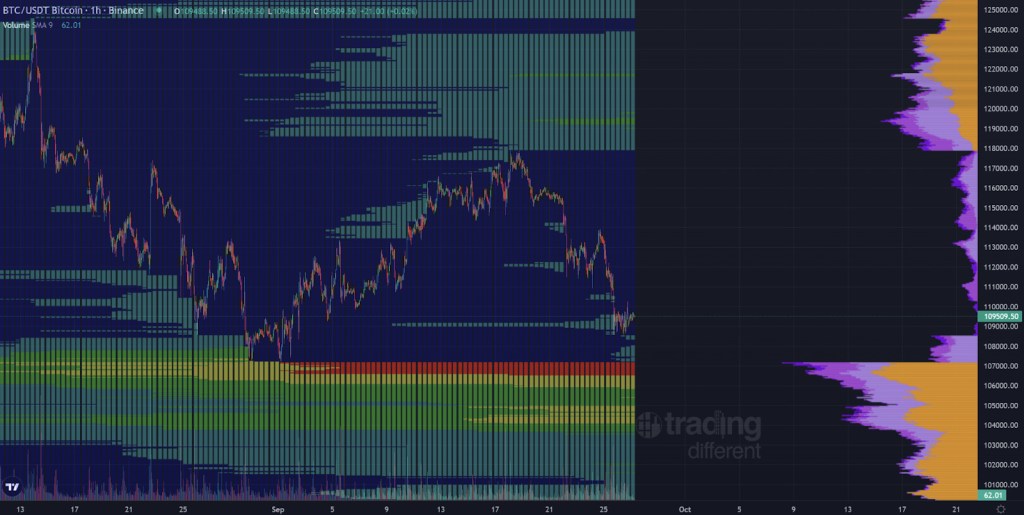
Bitcoin price found support near $108,680 and started a recovery wave. BTC is trading above $111,000 and facing hurdles near $112,500.
- Bitcoin started a fresh recovery wave above the $110,500 zone.
- The price is trading above $110,500 and the 100 hourly Simple moving average.
- There was a break above a connecting bearish trend line with resistance at $109,600 on the hourly chart of the BTC/USD pair (data feed from Kraken).
- The pair might continue to move up if it clears the $112,500 zone.
Bitcoin Price Starts Recovery
Bitcoin price managed to stay above the $108,500 zone and started a recovery wave . BTC settled above the $109,500 resistance zone to start the current move.
There was a clear move above the 50% Fib retracement level of the downward wave from the $113,940 swing high to the $108,680 low. Besides, there was a break above a connecting bearish trend line with resistance at $109,600 on the hourly chart of the BTC/USD pair.
The bulls even pushed the price above $112,000 before the bears appeared . Bitcoin is now trading above $111,500 and the 100 hourly Simple moving average.
Immediate resistance on the upside is near the $112,400 level. The first key resistance is near the $112,500 level and another trend line. The next resistance could be $113,700 or the 76.4% Fib retracement level of the downward wave from the $113,940 swing high to the $108,680 low.
A close above the $112,700 resistance might send the price further higher. In the stated case, the price could rise and test the $113,500 resistance. Any more gains might send the price toward the $114,500 level. The next barrier for the bulls could be $115,00.
Another Drop In BTC?
If Bitcoin fails to rise above the $112,500 resistance zone, it could start a fresh decline. Immediate support is near the $111,300 level. The first major support is near the $110,500 level.
The next support is now near the $109,500 zone. Any more losses might send the price toward the $108,800 support in the near term. The main support sits at $107,500, below which BTC might struggle to recover in the short term.
Technical indicators:
Hourly MACD – The MACD is now gaining pace in the bullish zone.
Hourly RSI (Relative Strength Index) – The RSI for BTC/USD is now above the 50 level.
Major Support Levels – $111,300, followed by $110,500.
Major Resistance Levels – $112,500 and $112,700.
Everyone’s Wrong About XRP: Here’s Why, Says Top Analyst
Top crypto commentator CryptoinsightUK argues that market consensus has misread the setup for XRP an...

Dogecoin Price Skirts Potential Demand Zone, What Happens If It Hits Right?
After rallying above $0.3 at the start of September, the Dogecoin price has faced significant resist...
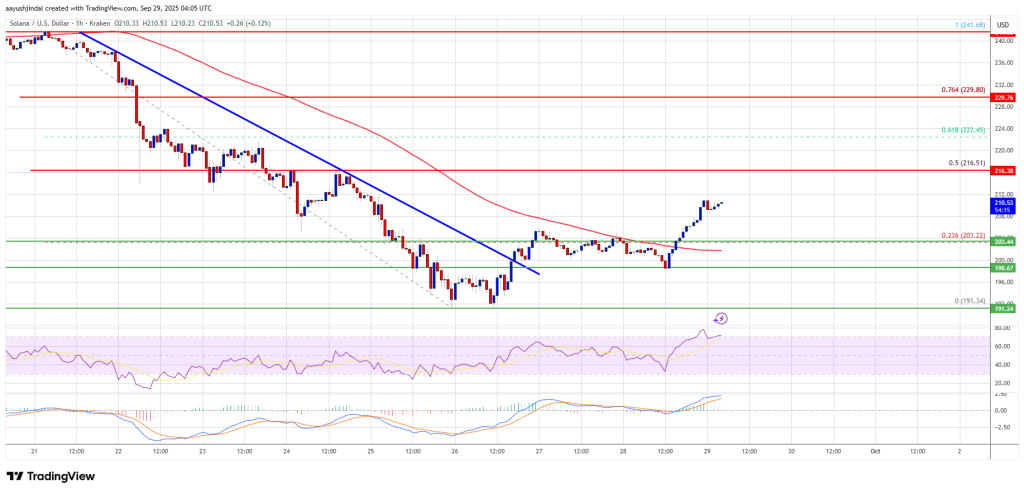
Solana (SOL) Shows Signs Of Rebound – Will Bears Step In Again Soon?
Solana started a fresh decline below the $225 zone. SOL price is now attempting to recover from $192...