Bitcoin Stochastic RSI Signals Brewing Bullish Momentum – ATH Incoming?


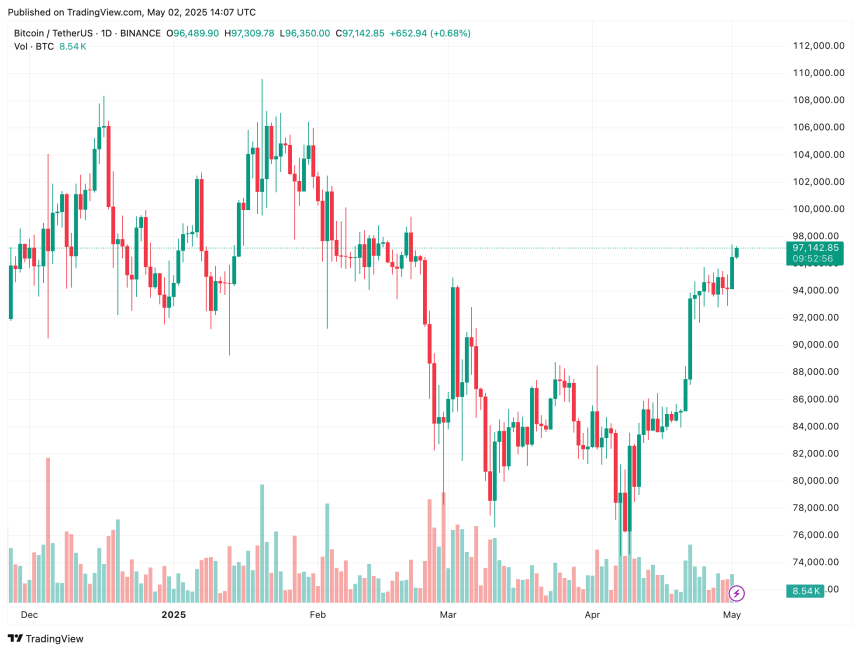
Bitcoin (BTC) has surged 14.6% over the past two weeks, rising from approximately $84,500 on April 18 to the mid-$90,000 range at the time of writing. With this upward momentum, the leading cryptocurrency appears to be setting its sights on a new all-time high (ATH), as several technical and momentum indicators hint at a growing bullish trend.
Bitcoin Monthly Stochastic RSI Turning Bullish
In a recent post on X, crypto analyst Titan of Crypto shared a BTC monthly chart indicating that the Stochastic Relative Strength Index (RSI) is on the verge of a bullish crossover.
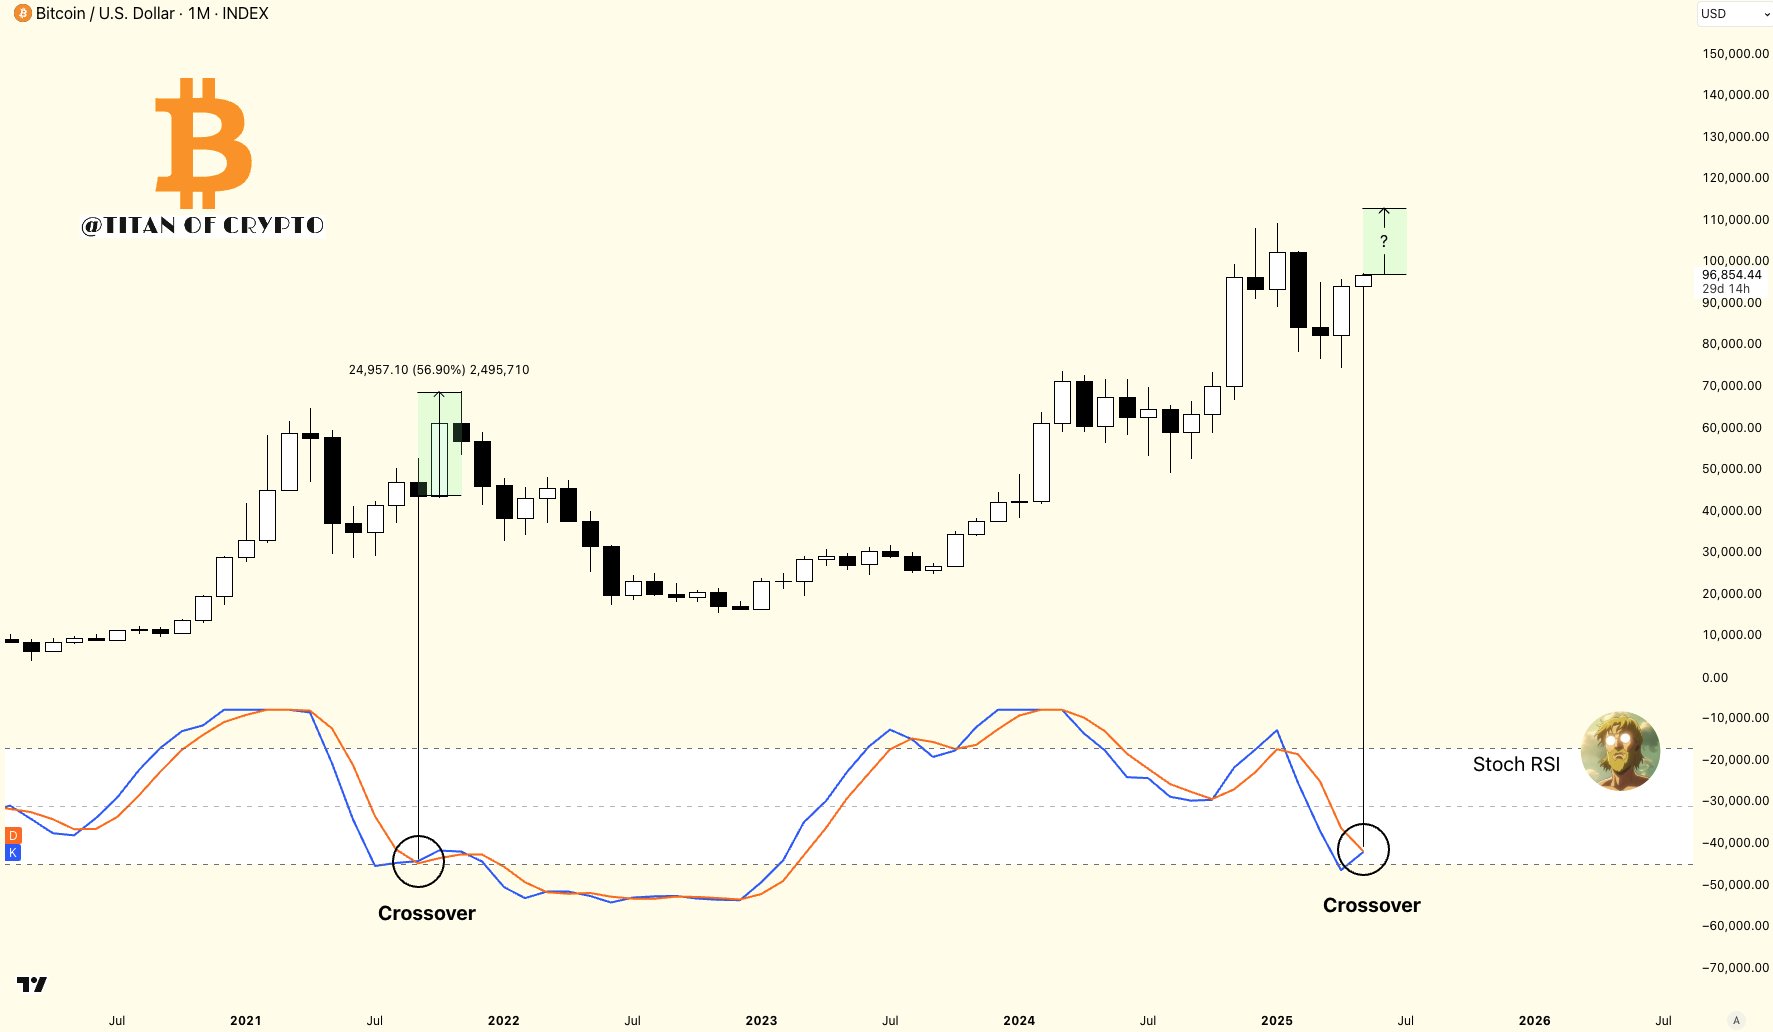
For the uninitiated, a Stochastic RSI bullish crossover signals growing upward momentum and is often interpreted as a potential buy signal or the start of a potential rally. Titan of Crypto added that if confirmed, the bullish crossover may initiate BTC’s next leg up.
As an example, the analyst referred to BTC’s price action on the monthly chart from back in Q3 2021. At the time, a similar bullish crossover in the Stochastic RSI preceded a 56.9% surge in Bitcoin’s price.
However, Bitcoin must hold above crucial support levels to maintain this bullish structure. In a separate X post, renowned analyst Ali Martinez noted that BTC could re-test the $95,700 support zone before advancing toward the $100,000 milestone.

On the resistance side, Martinez emphasized that $97,530 remains a “key level to watch.” A successful breakout beyond this threshold could pave the way for BTC to revisit or surpass its previous ATH. As it stands, Bitcoin is trading roughly 10% below its record high.
Analysts Predict BTC’s Next Move
Crypto analyst Rekt Capital also weighed in on BTC’s potential trajectory. In an X post published yesterday, he suggested that once BTC decisively breaks through the $97,000 to $99,000 zone, it could face rejection near $104,500. Following that, holding the $97,000–$99,000 range as support would be critical for BTC to launch toward new highs.
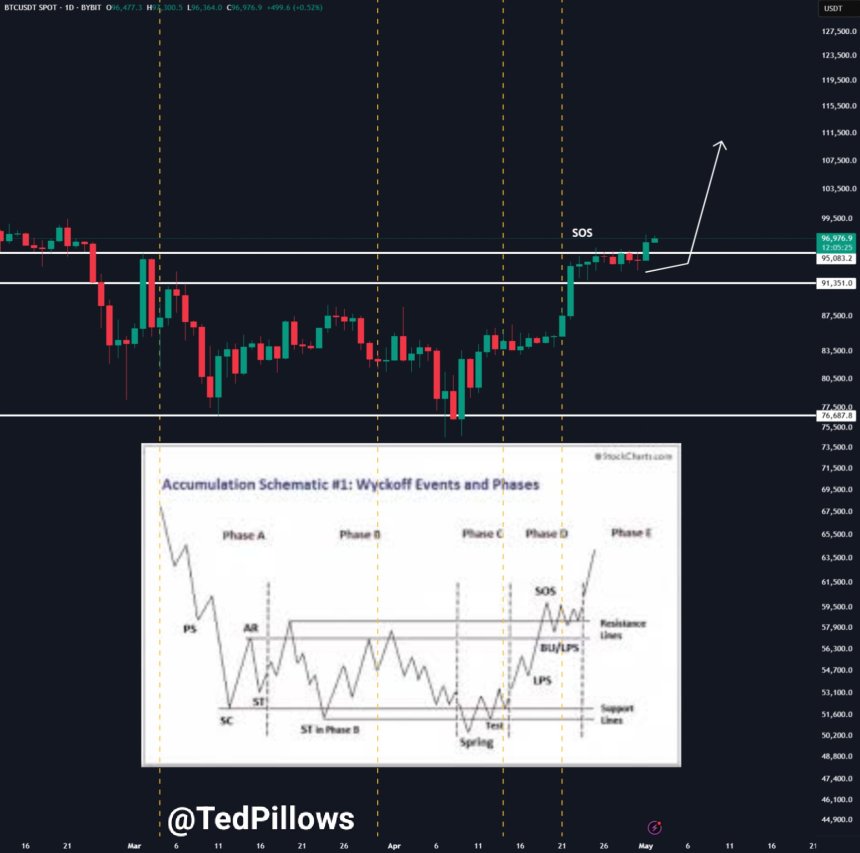
Similarly, analyst Ted noted that BTC is currently trading in a Wyckoff accumulation phase. The analyst added that BTC’s slide below $76,000 in early April was likely the bottom for this market cycle. He added:
Looking at the Wyckoff accumulation pattern, it seems like the $96K-$99K level could act as a resistance. I think BTC could consolidate here for a few days, before eventually breaking to the upside.
Despite bullish momentum, some concerns remain. Analysts caution that Bitcoin is unlikely to face a true supply shock in the immediate future, which could temper upside potential. At press time, BTC trades at $97,142, up 0.9% in the past 24 hours.
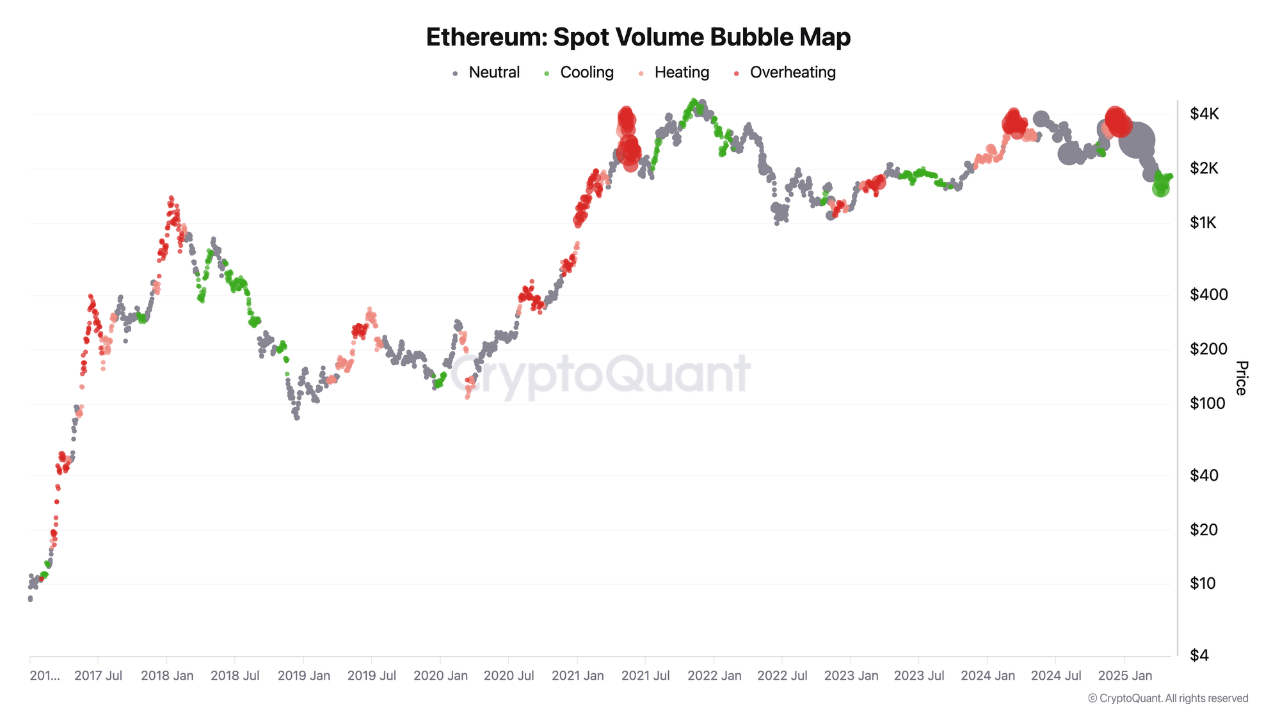
Ethereum Spot Volume Declines While Long-Term Holders Continue Accumulating
Ethereum (ETH) seems to have extended its period of price stagnation, trading at $1,770 at the time ...
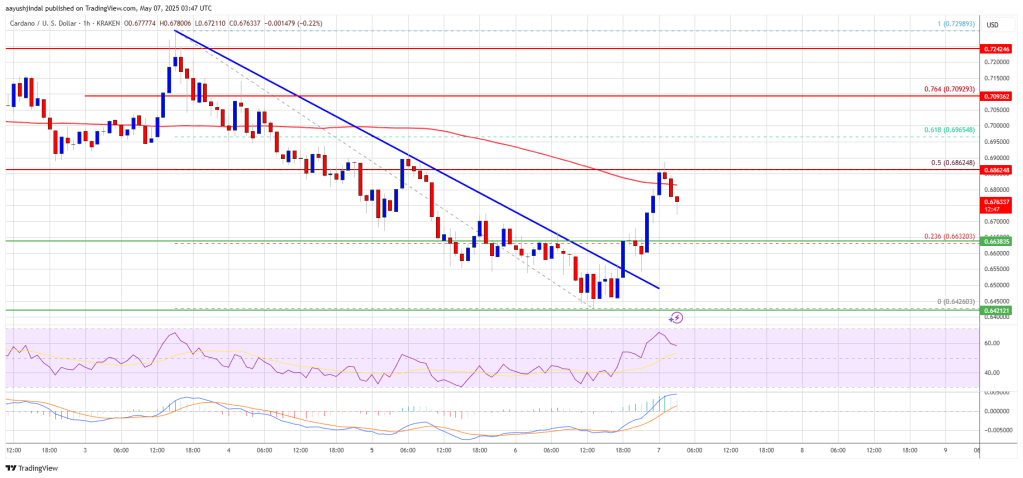
Cardano Bounce Losing Strength? ADA Recovery Could Fade Soon
Cardano price started a recovery wave from the $0.6420 zone. ADA is now facing resistance near $0.68...
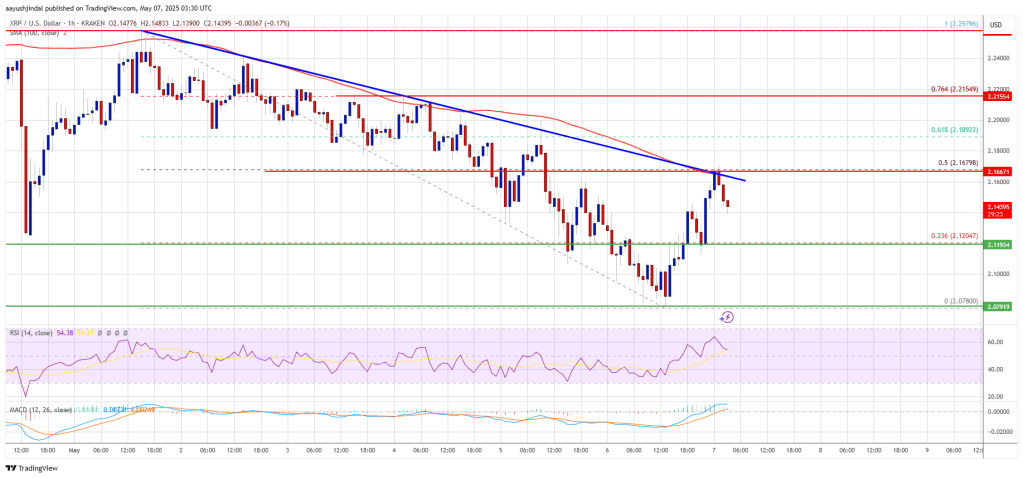
XRP Price Hits Resistance—Will the Bulls Push Through or Fade Away?
XRP price found support at $2.080 and started a fresh increase. The price is now facing resistance n...