Cardano Bounce Losing Strength? ADA Recovery Could Fade Soon


Cardano price started a recovery wave from the $0.6420 zone. ADA is now facing resistance near $0.6850 and might decline again.
- ADA price started a recovery wave from the $0.6420 zone.
- The price is trading below $0.680 and the 100-hourly simple moving average.
- There was a break above a connecting bearish trend line with resistance at $0.650 on the hourly chart of the ADA/USD pair (data source from Kraken).
- The pair could start another increase if it clears the $0.6850 resistance zone.
Cardano Price Faces Resistance
In the past few days, Cardano saw a fresh decline from the $0.730 level, like Bitcoin and Ethereum . ADA declined below the $0.70 and $0.680 support levels.
A low was formed at $0.6426 and the price is again moving higher. There was a move above the $0.6550 level. The price cleared the 23.6% Fib retracement level of the recent decline from the $0.7298 swing high to the $0.6426 low. Besides, there was a break above a connecting bearish trend line with resistance at $0.650 on the hourly chart of the ADA/USD pair.
However, the bears are active near the $0.6850 resistance and the 50% Fib retracement level of the recent decline from the $0.7298 swing high to the $0.6426 low. Cardano price is now trading below $0.680 and the 100-hourly simple moving average.
On the upside, the price might face resistance near the $0.680 zone. The first resistance is near $0.6850. The next key resistance might be $0.7090. If there is a close above the $0.7090 resistance, the price could start a strong rally. In the stated case, the price could rise toward the $0.730 region. Any more gains might call for a move toward $0.750 in the near term.
Another Drop in ADA?
If Cardano’s price fails to climb above the $0.6850 resistance level, it could start another decline. Immediate support on the downside is near the $0.6630 level.
The next major support is near the $0.6500 level. A downside break below the $0.650 level could open the doors for a test of $0.6320. The next major support is near the $0.6175 level where the bulls might emerge.
Technical Indicators
Hourly MACD – The MACD for ADA/USD is losing momentum in the bullish zone.
Hourly RSI (Relative Strength Index) – The RSI for ADA/USD is now above the 50 level.
Major Support Levels – $0.6630 and $0.6500.
Major Resistance Levels – $0.6850 and $0.7090.
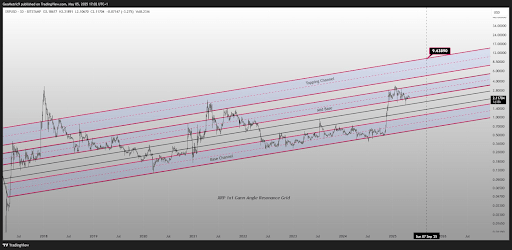
XRP Price At $9 In September: Gann Angle Resistance Grid Predicts Surge
XRP’s price action in the past seven days has been marked by a consistent decline from $2.25, puttin...
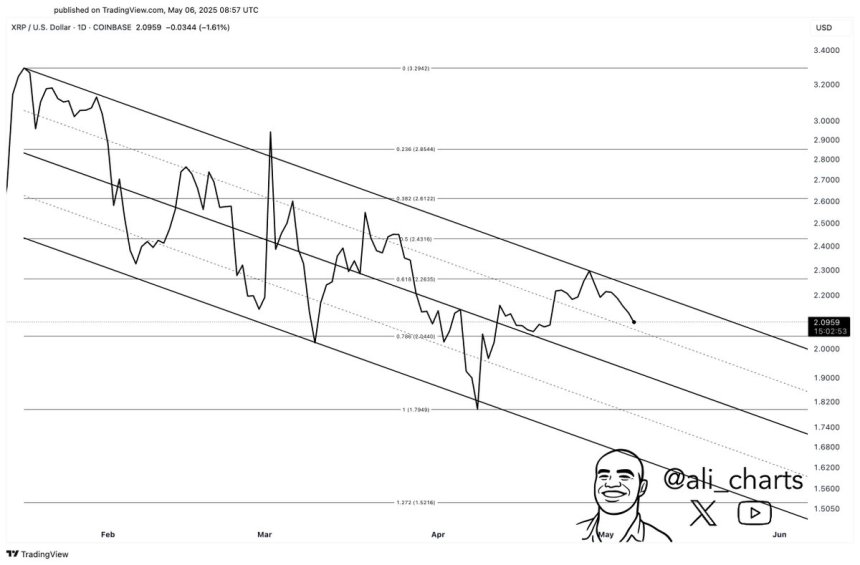
XRP Bulls Expect A Breakout As Price Compresses Between Key Levels – Details
XRP is trading at a pivotal level as the broader crypto market regains strength and bullish sentimen...
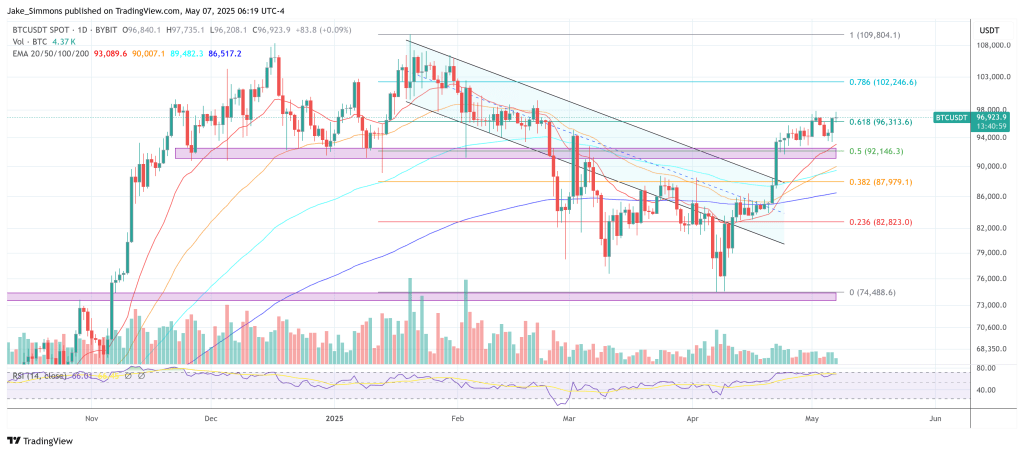
Bitcoin Poised To Retest All-Time High If This Level Holds, Says Bitfinex
Bitcoin’s resurgence in April has positioned it for a potential breakout toward its all-time high—pr...