XRP Price Softens — Momentum Weakness Could Limit Upside In Near Term


XRP price started a fresh increase above $2.550. The price is now facing hurdles above $2.650 and at risk of another decline in the near term.
- XRP price gained pace for a move above $2.60 and $2.620 before the bears appeared.
- The price is now trading below $2.60 and the 100-hourly Simple Moving Average.
- There was a break below a bullish trend line with support at $2.6350 on the hourly chart of the XRP/USD pair (data source from Kraken).
- The pair could start a fresh increase if it stays above $2.50.
XRP Price Retreats Lower
XRP price started a fresh increase after it settled above $2.50, like Bitcoin and Ethereum . The price surpassed the $2.550 and $2.60 resistance levels.
The bulls were able to push the price above $2.650. A high was formed at $2.6972 and the price recently started a downside correction. There was a move below the 23.6% Fib retracement level of the recent move from the $2.327 swing low to the $2.6972 high.
Besides, there was a break below a bullish trend line with support at $2.6350 on the hourly chart of the XRP/USD pair. The price is now trading below $2.60 and the 100-hourly Simple Moving Average.
If there is a fresh upward move, the price might face resistance near the $2.620 level. The first major resistance is near the $2.650 level, above which the price could rise and test $2.6880. A clear move above the $2.6880 resistance might send the price toward the $2.720 resistance. Any more gains might send the price toward the $2.7650 resistance. The next major hurdle for the bulls might be near $2.80.
More Losses?
If XRP fails to clear the $2.650 resistance zone, it could start a fresh decline. Initial support on the downside is near the $2.5650 level. The next major support is near the $2.550 level.
If there is a downside break and a close below the $2.550 level, the price might continue to decline toward $2.5120 or the 50% Fib retracement level of the recent move from the $2.327 swing low to the $2.6972 high. The next major support sits near the $2.450 zone, below which the price could continue lower toward $2.40.
Technical Indicators
Hourly MACD – The MACD for XRP/USD is now gaining pace in the bearish zone.
Hourly RSI (Relative Strength Index) – The RSI for XRP/USD is now below the 50 level.
Major Support Levels – $2.550 and $2.5120.
Major Resistance Levels – $2.650 and $2.6880.

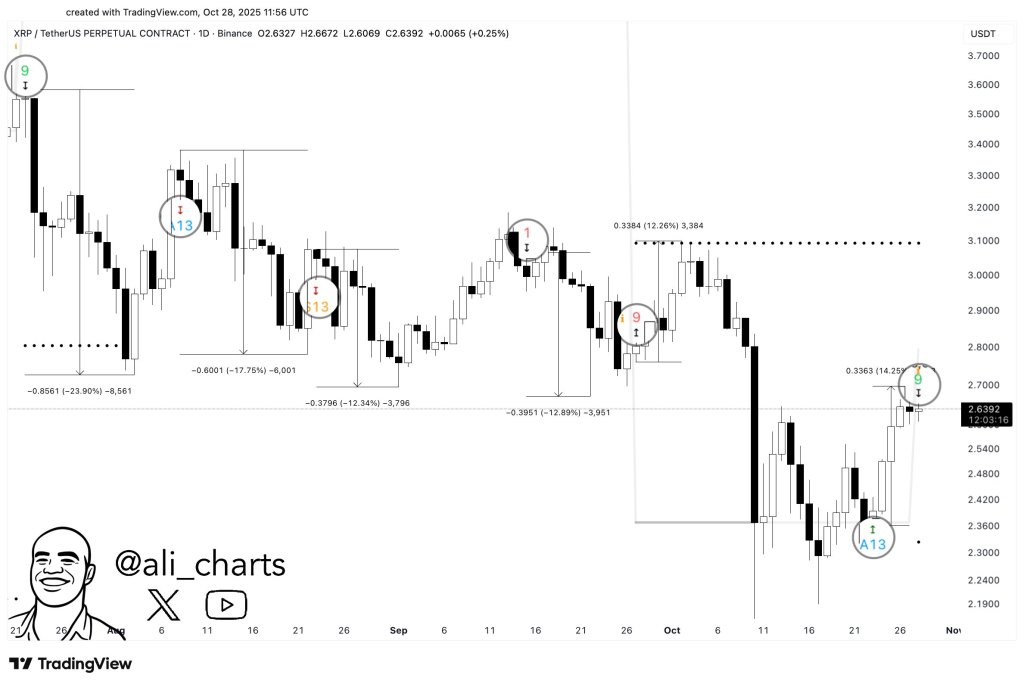
Is XRP Headed For A 16% Drop? Signal Flashes Familiar Warning
Crypto analyst Ali Martinez has cautioned that XRP may be approaching another downswing after the To...

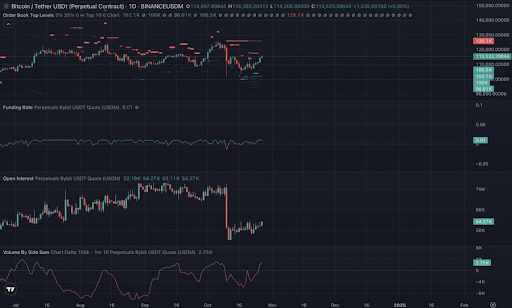
Analyst Reveals What Traders Are Missing After The Bitcoin Price Spike To $116,000
Crypto analyst Adez has revealed what most traders are missing following the Bitcoin price rally to ...

Massive XRP Rally Ahead? Bold Forecast Calls For $100 Before 2030
Based on reports, several asset managers have updated filings for spot XRP exchange-traded funds, na...

