Bitcoin Price Slides Lower — Bears Tighten Grip Amid Weak Market Sentiment


Bitcoin price is attempting to recover above $107,500 and $108,000. BTC could rise further if there is a clear move above the $109,500 barrier.
- Bitcoin started a fresh recovery wave above the $108,000 resistance level.
- The price is trading below $109,000 and the 100 hourly Simple moving average.
- There is a short-term declining channel forming with resistance at $108,800 on the hourly chart of the BTC/USD pair (data feed from Kraken).
- The pair might continue to move up if it trades above the $109,500 zone.
Bitcoin Price Takes Hit
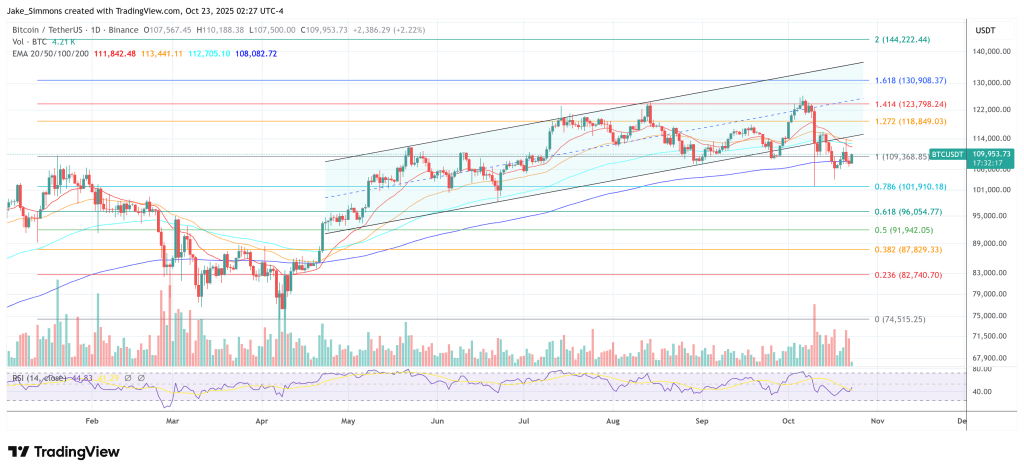
Bitcoin price declined again below the $109,500 level. BTC tested the $106,750 zone and is currently consolidating losses . A low was formed at $106,717 before the price recovered some losses.
There was a move above the $107,500 and $108,000 levels. The price climbed above the 23.6% Fib retracement level of the recent decline from the $114,000 swing high to the $106,717 low. However, the bulls are now facing many hurdles.
Bitcoin is now trading below $109,000 and the 100 hourly Simple moving average . Immediate resistance on the upside is near the $108,800 level. There is also a short-term declining channel forming with resistance at $108,800 on the hourly chart of the BTC/USD pair.
The first key resistance is near the $109,500 level. The next resistance could be $110,500 or the 50% Fib retracement level of the recent decline from the $114,000 swing high to the $106,717 low. A close above the $110,500 resistance might send the price further higher. In the stated case, the price could rise and test the $111,500 resistance. Any more gains might send the price toward the $112,000 level. The next barrier for the bulls could be $113,500.
Another Drop In BTC?
If Bitcoin fails to rise above the $109,500 resistance zone, it could start a fresh decline. Immediate support is near the $107,200 level. The first major support is near the $106,750 level.
The next support is now near the $105,800 zone. Any more losses might send the price toward the $105,000 support in the near term. The main support sits at $103,500, below which BTC might struggle to recover in the short term.
Technical indicators:
Hourly MACD – The MACD is now losing pace in the bearish zone.
Hourly RSI (Relative Strength Index) – The RSI for BTC/USD is now near the 50 level.
Major Support Levels – $108,000, followed by $106,750.
Major Resistance Levels – $109,500 and $110,500.

16,000 Ancient Bitcoins Just Moved—And It’s Costing Whales Billions
A cluster of long-idle Bitcoin moved back into circulation Wednesday, raising fresh questions about ...
Last-Ever Bitcoin Dip Below $100,000 Looms This Week, Standard Chartered Warns
Bitcoin hovered near the mid-$100,000s on Thursday, Oct. 23, as Standard Chartered’s global head of ...
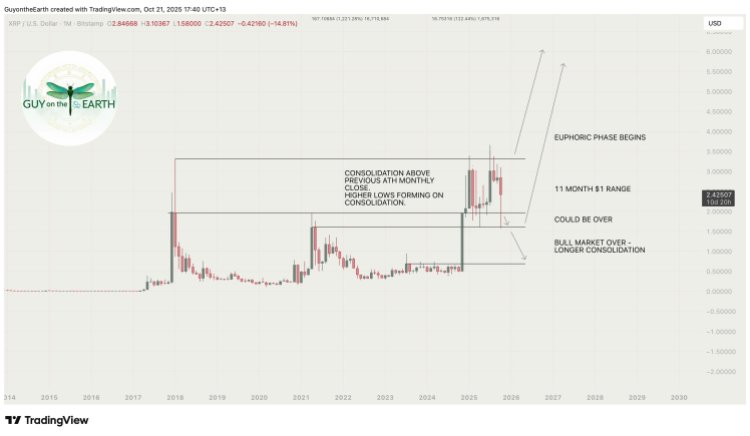
XRP Price Teleport To $6: What Happens When The Euphoric Phase Begin
The recent market recovery has seen the XRP price look to break the $2.5 level again, which could le...