Bitcoin Crash Unlike LUNA & FTX Collapses, Says Glassnode: Here’s Why


On-chain analytics firm Glassnode has explained how the latest Bitcoin selloff is different from the LUNA and FTX crashes of 2022.
Bitcoin Supply In Profit Trend Is Structurally Different For The Latest Crash
In a new post on X, Glassnode has discussed how the recent bearish action in BTC compares against some of the past crashes. The analytics firm has used the Percent Supply in Profit to make the comparison. This on-chain indicator measures, as its name suggests, the percentage of the total Bitcoin circulating supply that’s sitting on some net unrealized gain right now.
The metric works by going through the transaction history of each token in circulation to see what price it was last transferred or sold at. If this previous transaction price was less than the latest spot price for any token, then it may be considered to be currently sitting on some profit.
The Percent Supply in Profit adds up all coins of this type and determines what percentage of the supply they make up. Another indicator called the Percent Supply in Loss tracks the tokens of the opposite type. If one of these indicators is known, the other can simply be calculated by subtracting it from 100, since the total BTC supply must add up to 100%.
Now, here is the chart shared by Glassnode that shows the trend in the Bitcoin Percent Supply in Profit over the last few years:
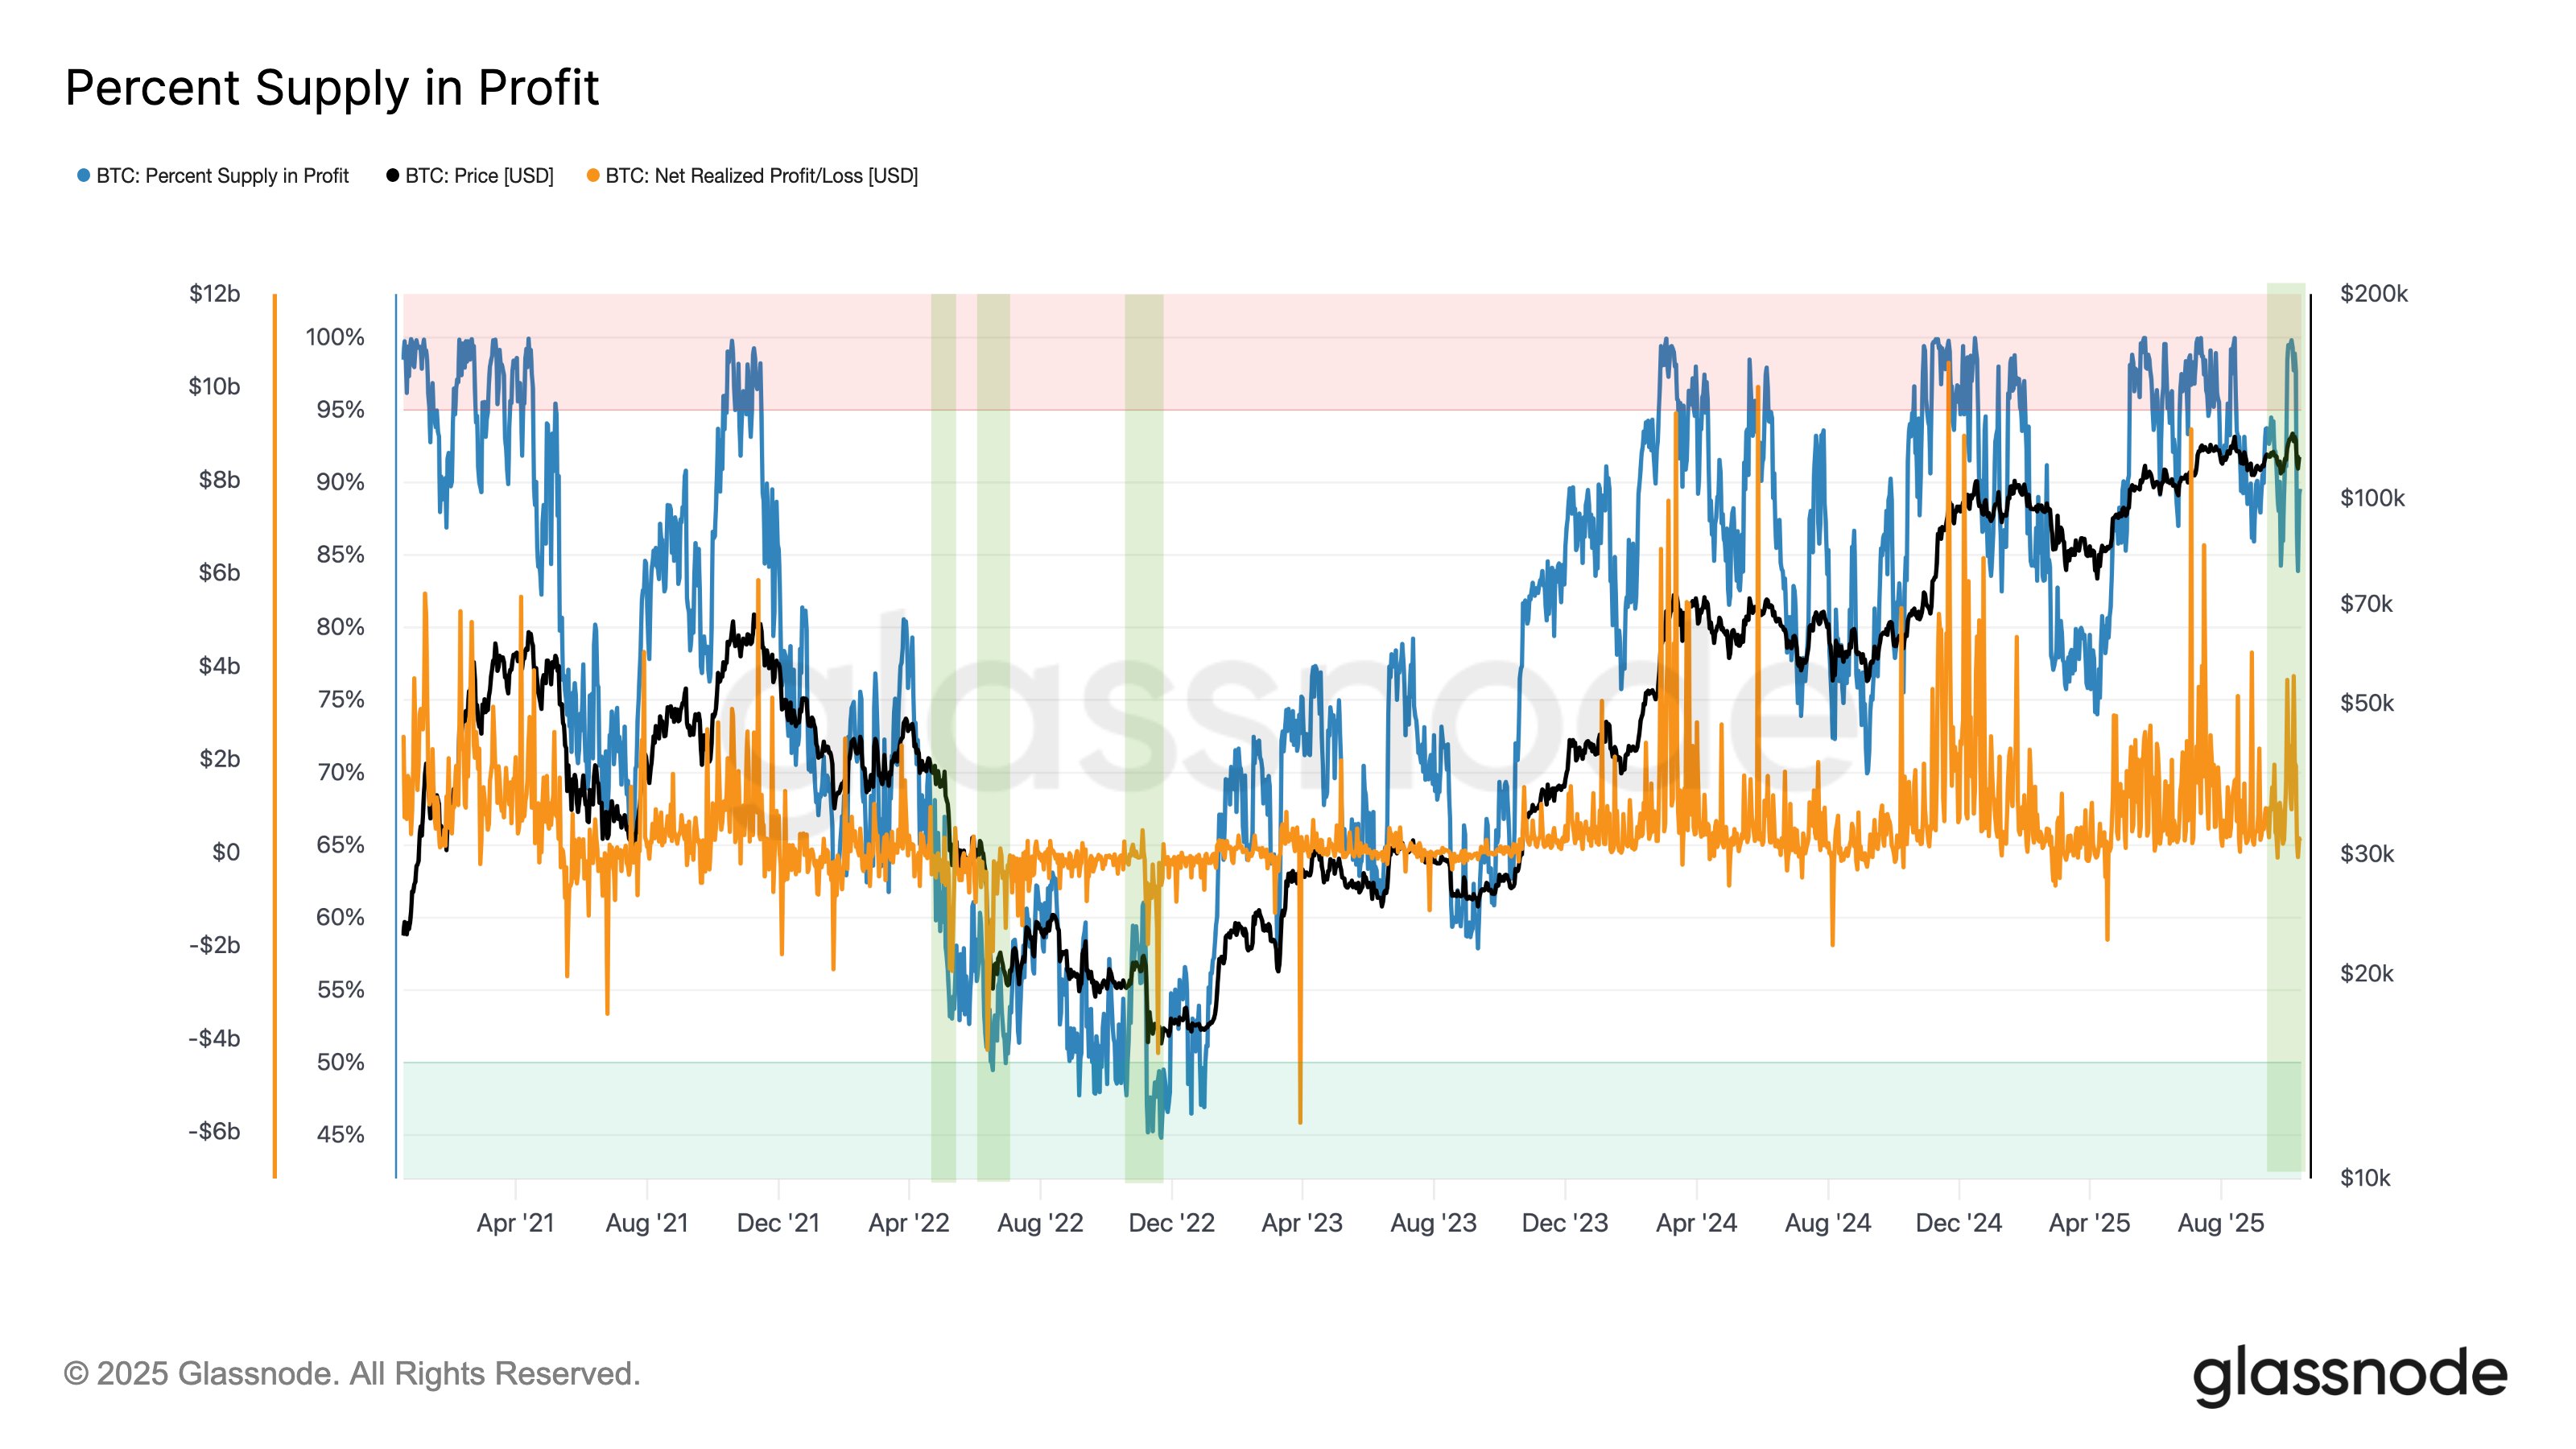
As is visible in the above graph, the Bitcoin Percent Supply in Profit hit the 100% mark earlier in the month when the cryptocurrency’s price set its new all-time high (ATH). When the sharp selloff at the end of last week started, the indicator’s value was still well over the 90% mark, meaning the vast majority of investors were in the green. As such, the crash was more profit-driven, with losses mostly coming from the top buyers.
During some of the big crashes of the 2022 bear market , however, the market conditions were quite different. In the LUNA and FTX collapses, the Percent Supply in Profit sat under 65%.
In the chart, Glassnode has also highlighted the data of another metric: the Net Realized Profit/Loss, measuring whether profit-taking or loss-taking is dominant on the BTC network. From this indicator, it’s apparent that the aforementioned crashes saw deep negative values, implying a broad capitulation event took place.
The 3AC collapse occurred alongside a higher Percent Supply in Profit, but it also witnessed a notable spike in loss-taking. Based on this, Glassnode concludes that the latest Bitcoin crash was “a structurally different, leverage-driven event.”
BTC Price
At the time of writing, Bitcoin is trading around $110,400, down more than 11% over the last week.

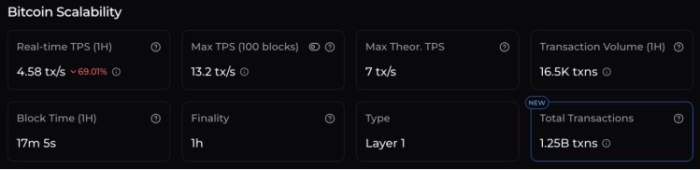
Bitcoin Hyper Could Be the Explosive Fix for Bitcoin’s Biggest Problems
What to Know: Bitcoin Hyper has raised over $23.7M in its presale, with tokens priced at $0.013115. ...
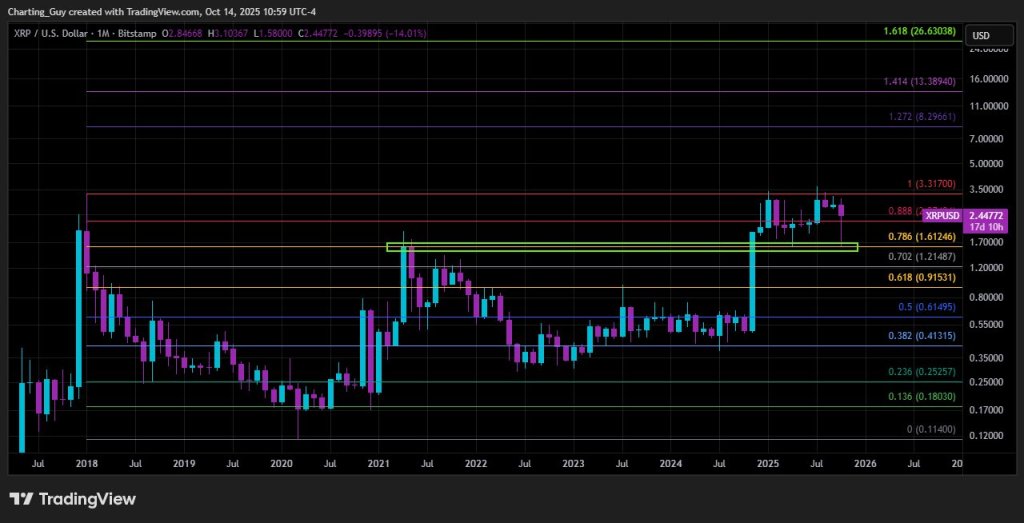
$26 XRP Price Target Remains Technically Valid, Says Expert
The XRP monthly chart remains structurally constructive despite last week’s sharp pullback, accordin...
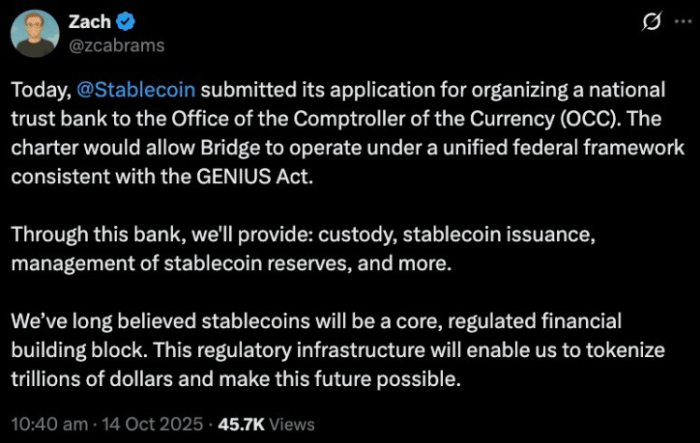
Stripe’s Bridge Leads the Stablecoin Season, and Could Boost Best Wallet Token
What to Know: Stripe’s stablecoin arm, Bridge, has applied for a US national trust bank charter unde...