Bitcoin Dynamics Show Healthy Market Structure: Analyst Sets $130K Target


Bitcoin has reclaimed key levels above the $118,000 mark, shifting momentum back in favor of the bulls after weeks of uncertainty. The breakout has reinvigorated sentiment across the market, with traders increasingly confident that BTC could be on the verge of a major move. Historically, October has been one of the strongest months for Bitcoin performance, and some analysts are already calling for a massive impulse that could carry the asset toward new highs.
What makes this rally especially notable is the underlying stability reflected in market data. Top analyst Axel Adler shared insights showing that Bitcoin currently sits in equilibrium, where buying and selling pressure are balanced. This condition often signals a healthy market structure, creating a strong base for potential upside. If momentum holds, the combination of bullish seasonal patterns and a stable equilibrium could fuel an aggressive continuation of the cycle.
Still, analysts caution that the next few days will be critical. Reclaiming $118,000 is a strong first step, but Bitcoin will need to build support above this threshold to confirm the breakout and sustain its trajectory. With volatility returning, October may once again prove to be a decisive month for Bitcoin.
Bitcoin Dynamics Align With A Key Indicator
In a CryptoQuant report , Adler explains that Bitcoin’s current price behavior aligns closely with the STH-MVRV pricing corridor, a metric designed to reflect the average profitability of recent buyers. This corridor provides a framework for evaluating when short-term holders are in profit and more likely to sell, versus when they are at a loss and likely to capitulate. At present, Bitcoin sits comfortably within this range, suggesting a healthy equilibrium in market dynamics.
The upper boundary of the corridor, defined as +1σ, currently hovers around $130,000. Adler notes that this level represents a zone where short-term holders typically begin to lock in profits more aggressively. Historically, price approaches to this boundary have triggered waves of selling, providing a natural cap until stronger demand emerges. Nevertheless, the existence of this upper bound gives the market a clear target, and if current dynamics persist, a move toward $130K appears increasingly realistic.
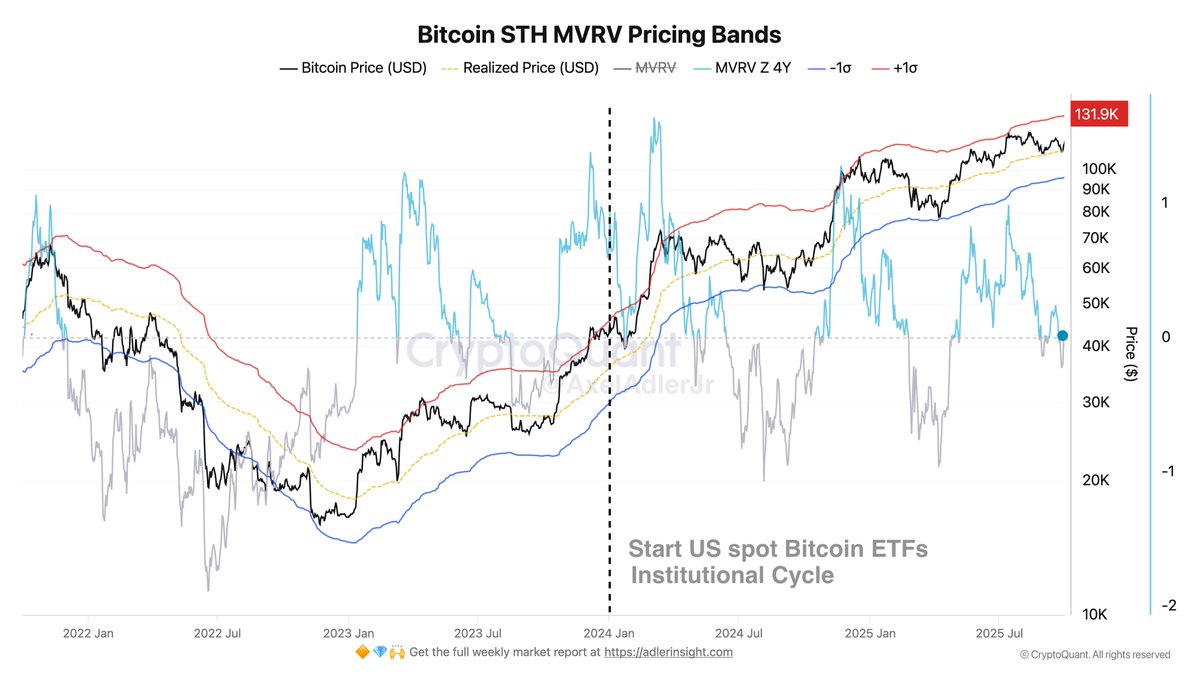
Equally important is the baseline of the corridor, which reflects the average realized price of short-term holders. Since the beginning of 2024, Bitcoin has consistently held above this level (marked by the yellow line on the chart). This persistent strength signals sustained bullish sentiment, as short-term drops below the baseline have been quickly bought up, reflecting robust demand.
In effect, Bitcoin remains in a state of equilibrium—neither overheated nor oversold—within the established volatility corridor. This balance, combined with the historical seasonality of October rallies and strong institutional flows, positions the market favorably for potential upside. If buying pressure continues and volatility contracts, the probability of an advance toward the $130K zone becomes a tangible scenario in the weeks ahead.
Bitcoin Faces Resistance After A Rally
Bitcoin is trading around $118,800 on the 12-hour chart, extending its breakout from earlier this week. Price has surged past the key $117,500 resistance, a level that capped rallies throughout September, and is now testing the $119,000–$120,000 area. This zone represents the final hurdle before a potential retest of summer highs near $125,000.

The moving averages show improving momentum. BTC has reclaimed the 50-period (blue) and 100-period (green) moving averages with strong follow-through, turning them into short-term support zones around $114,000–$115,000. Meanwhile, the 200-period (red) moving average continues to rise from below, reinforcing the longer-term bullish trend. The decisive break above multiple averages in just a few sessions highlights the strength of buyer conviction.
However, the chart also suggests that Bitcoin is entering overextended territory in the short term. After four consecutive bullish candles, a period of consolidation around $118,000–$119,000 would not be surprising. A failure to hold above $117,500 could see a pullback toward $115,000, while sustained buying could confirm a path to $120,000 and beyond.
Featured image from ChatGPT, chart from TradingView.com
Dogecoin Consolidates After Recent Rejection, But $0.32 Retest Looks Inevitable
Dogecoin is cooling off after its recent rejection near $0.307, with price action now consolidating ...
Pundit’s ‘Outrageous’ $170,000 Target For XRP Price Draws Attention, Says Don’t Use ‘Old World’ Math
The XRP price has often drawn ambitious forecasts, but few as outrageous as a recent prediction plac...
Zcash (ZEC) Explodes 170% In Just 5 Days — What’s Driving The Rally?
Zcash (ZEC) has staged one of the sharpest recoveries of the quarter, vaulting roughly 160%–170% fro...