XRP Price Slips Under $3 – Can Bulls Stage a Quick Rebound?


XRP price started a downside correction from the $3.180 resistance. The price is now consolidating and might start another increase if it clears $3.050.
- XRP price is consolidating losses after declining from the $3.180 resistance.
- The price is now trading below $3.050 and the 100-hourly Simple Moving Average.
- There is a bearish trend line forming with resistance at $3.020 on the hourly chart of the XRP/USD pair (data source from Kraken).
- The pair could start a fresh increase if the price clears the $3.050 zone.
XRP Price Corrects Gains
XRP price started a downside correction below the $3.120 level, like Bitcoin and Ethereum . The price dipped below the $3.050 level to enter a short-term bearish zone.
There was a move below the $3.00 pivot level and the 100-hourly Simple Moving Average. A low was formed at $2.957 and the price is now consolidating losses. There was a minor move above the 23.6% Fib retracement level of the downward move from the $3.186 swing high to the $2.957 low.
The price is now trading below $3.050 and the 100-hourly Simple Moving Average. Besides, there is a bearish trend line forming with resistance at $3.020 on the hourly chart of the XRP/USD pair.
If the bulls protect the $2.950 support, the price could attempt another increase. On the upside, the price might face resistance near the $3.020 level. The first major resistance is near the $3.050 level. A clear move above the $3.050 resistance might send the price toward the $3.120 resistance. Any more gains might send the price toward the $3.180 resistance. The next major hurdle for the bulls might be near $3.250.
More Downsides?
If XRP fails to clear the $3.020 resistance zone, it could continue to move down. Initial support on the downside is near the $2.950 level. The next major support is near the $2.920 level.
If there is a downside break and a close below the $2.920 level, the price might continue to decline toward $2.880. The next major support sits near the $2.840 zone, below which the price could gain bearish momentum.
Technical Indicators
Hourly MACD – The MACD for XRP/USD is now losing pace in the bearish zone.
Hourly RSI (Relative Strength Index) – The RSI for XRP/USD is now below the 50 level.
Major Support Levels – $2.950 and $2.920.
Major Resistance Levels – $3.020 and $3.050.
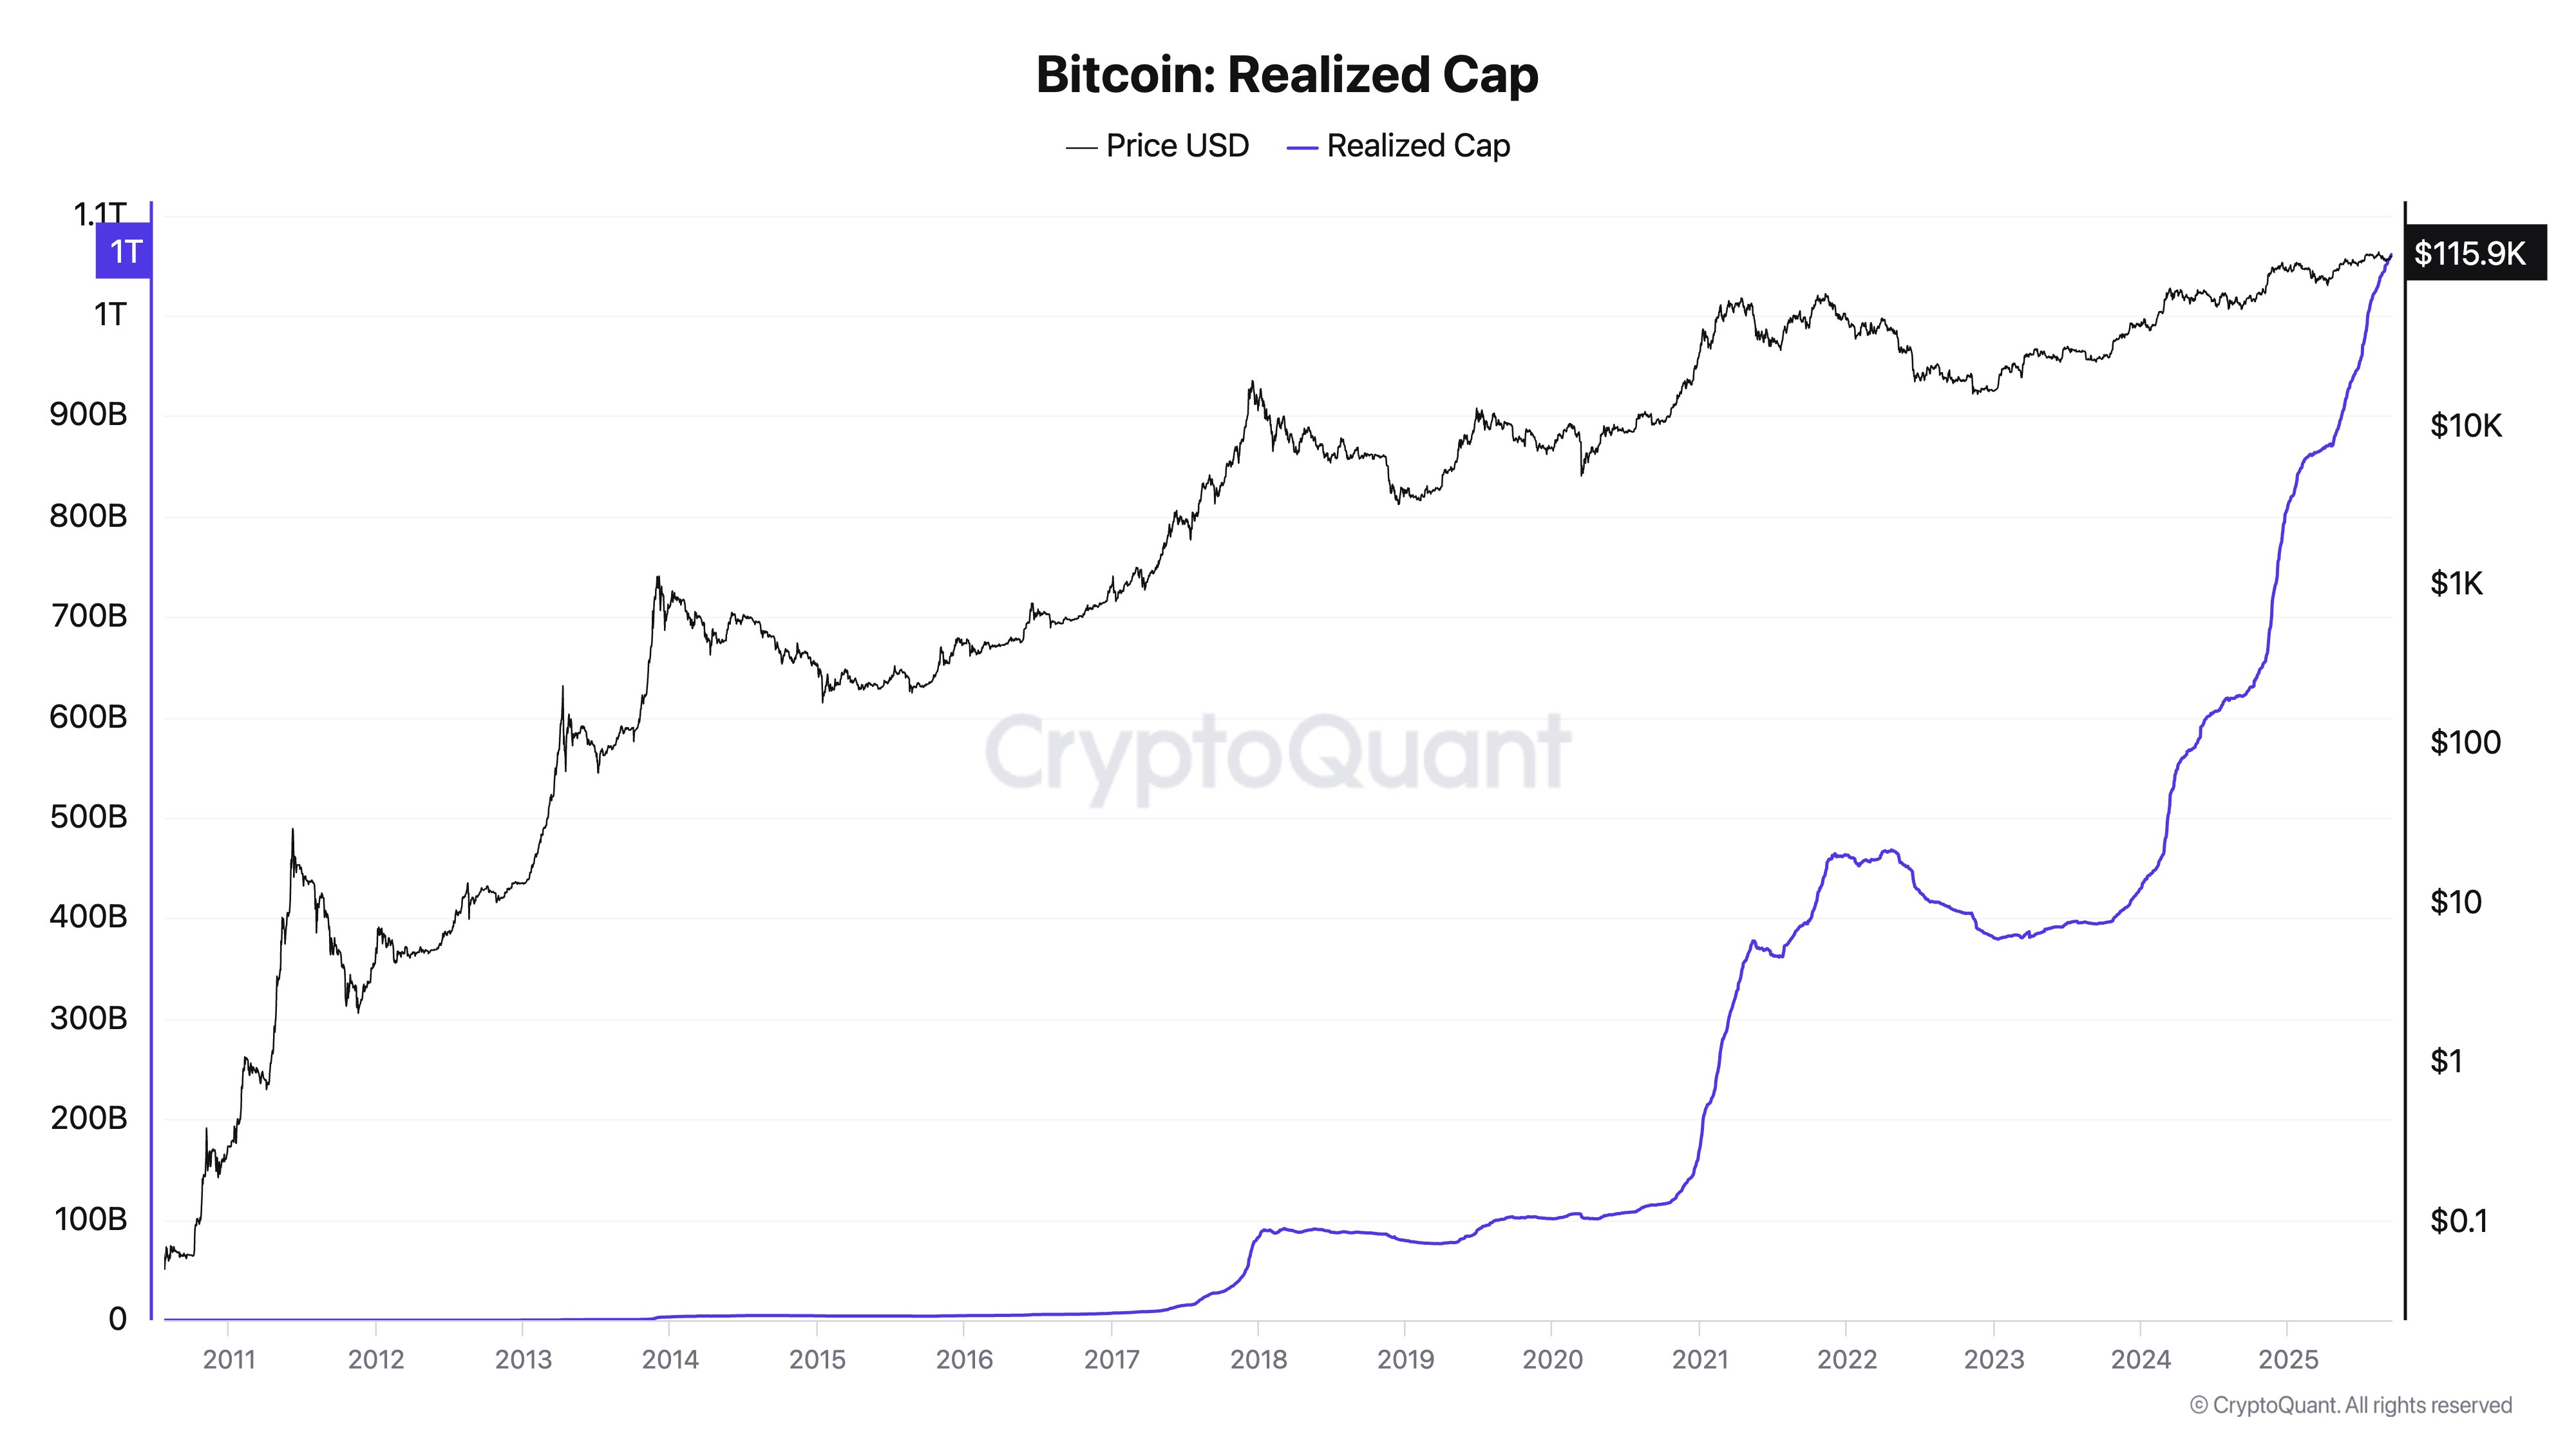
Bitcoin Inflows In Last 1.5 Years Surpassed First 15 Years Combined: Data
On-chain data shows inflows into Bitcoin have recently been so large that they outweigh the cumulati...
Analyst Raises Red Flags On Bitcoin Price: Allegations Of Market Manipulation
As investor anxiety grows over the possibility of a new bearish cycle, the case for Bitcoin (BTC) to...

Solana (SOL) Corrects Some Gains – Is a Bigger Pullback Coming?
Solana started a fresh increase above the $232 zone. SOL price is now correcting gains below $240 an...