Cardano (ADA) Faces Selling Pressure – Is This the Start of a Trend?


Cardano price started a fresh decline below the $0.850 zone. ADA is now consolidating and might extend losses below the $0.80 support.
- ADA price started a fresh decline below the $0.850 support zone.
- The price is trading below $0.8320 and the 100-hourly simple moving average.
- There is a key bearish trend line forming with resistance at $0.820 on the hourly chart of the ADA/USD pair (data source from Kraken).
- The pair could start a fresh increase if it clears the $0.820 resistance zone.
Cardano Price Dips Further
After a steady increase, Cardano faced sellers near $0.880 and started a downside correction, like Bitcoin and Ethereum . ADA dipped below the $0.850 and $0.8320 support levels.
The bears even pushed the price below $0.820. A low was formed at $0.8003 and the price is now consolidating losses. There was a minor increase toward the 23.6% Fib retracement level of the recent decline from the $0.8376 swing high to the $0.8003 low.
Cardano price is now trading below $0.820 and the 100-hourly simple moving average. There is also a key bearish trend line forming with resistance at $0.820 on the hourly chart of the ADA/USD pair.
On the upside, the price might face resistance near the $0.820 zone. The first resistance is near $0.8280 or the 76.4% Fib retracement level of the recent decline from the $0.8376 swing high to the $0.8003 low. The next key resistance might be $0.840.
If there is a close above the $0.840 resistance, the price could start a strong rally. In the stated case, the price could rise toward the $0.8620 region. Any more gains might call for a move toward $0.880 in the near term.
Another Decline In ADA?
If Cardano’s price fails to climb above the $0.840 resistance level, it could start another decline. Immediate support on the downside is near the $0.80 level.
The next major support is near the $0.780 level. A downside break below the $0.780 level could open the doors for a test of $0.7620. The next major support is near the $0.750 level where the bulls might emerge.
Technical Indicators
Hourly MACD – The MACD for ADA/USD is gaining momentum in the bearish zone.
Hourly RSI (Relative Strength Index) – The RSI for ADA/USD is now below the 50 level.
Major Support Levels – $0.8000 and $0.7800.
Major Resistance Levels – $0.8200 and $0.8400.

Germany’s Biggest TV Channel Features Ripple, XRP On Air
Ripple and its native token XRP have been given rare mainstream exposure on German finance channel D...
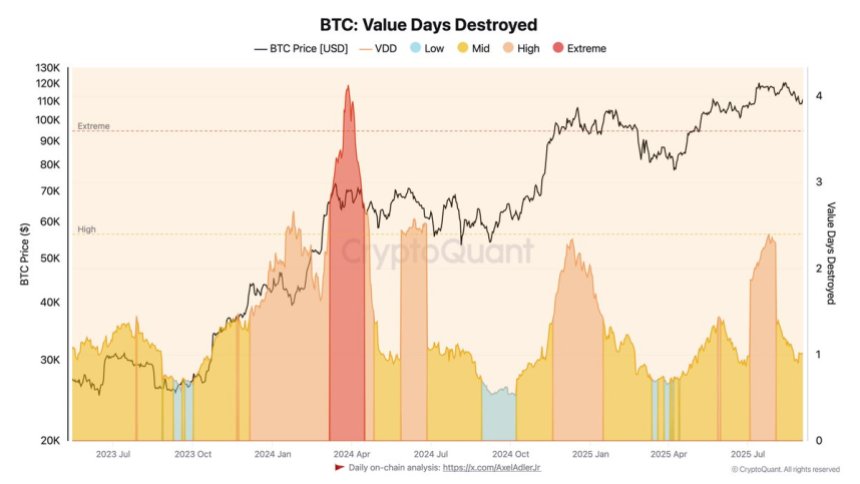
Bitcoin Cycle Structure Questioned As VDD Mirrors Historic Tops
Bitcoin is trading above the $112,000 level, but its momentum is faltering as selling pressure inten...

AI Agents Are Hungry; Web3 Data Is a Mess : Why an AI-Ready Data Layer Is the Need of the Hour
AI agents are simple to describe and complex to serve: observe → decide → act → learn. Each loop dep...