Bitcoin’s Next Stop $183K? On-Chain Data Points to Explosive Cycle Peak


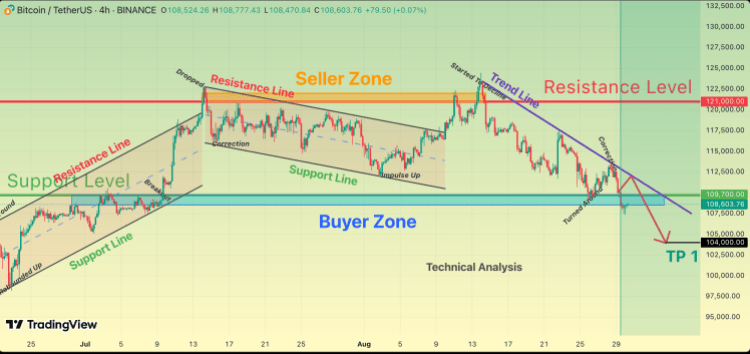
Bitcoin remains under pressure after sliding from its all-time high above $124,000 earlier this month. At the time of writing, the asset trades at $110,219, reflecting a weekly decline of about 2% and a broader drop of more than 10% from its peak.
Despite the correction, analysts continue to examine on-chain data for signs of the market’s next direction. Among the latest insights , CryptoQuant contributor CryptoOnchain highlighted the significance of the MVRV (Market Value to Realized Value) Price Bands, a long-observed metric used to assess market cycles.
According to the analyst, Bitcoin’s current positioning above key support bands suggests the uptrend remains intact, but with room for both continued growth and potential volatility.
MVRV Price Bands Point to Potential Cycle Top
The MVRV Price Bands model has historically been used to identify both bottoms and tops in Bitcoin’s long-term cycles. CryptoOnchain noted that the model’s lower band, often referred to as the “floor price,” reliably marked market lows in 2018 and 2022, while the upper band highlighted cycle peaks such as 2017 and 2021.

Currently, Bitcoin’s trading price is positioned well above the model’s floor price of around $52,300 and its median support level of approximately $91,600. This indicates what the analyst referred to as a “healthy uptrend” with persistent activity from long-term holders.
Importantly, the model’s projected ceiling price suggests that Bitcoin could reach as high as $183,000 by August 2025, assuming historical trends remain consistent.
The analyst emphasized that while the ceiling level offers a potential target, traders should monitor the mid-price band for signs of weakening momentum . A decisive move below this level could indicate a shift in trend, raising the possibility of deeper corrections even within a bullish cycle.
Bitcoin Cost Basis Trends Reflect Market Behavior
A separate analysis by CryptoQuant contributor BorisD provided additional context by examining the cost basis of Bitcoin investors on Binance. Data shows that the average deposit address cost basis on Binance has risen from $44,000 earlier this year to $62,000.
This suggests that investors are actively accumulating at higher price zones, particularly around Bitcoin’s recent peaks. New whale investors, defined as large-scale buyers with significant holdings, currently hold an average cost basis of $108,000, which is emerging as a key support level.

According to BorisD, this level could serve as the foundation for the next leg of upward momentum if demand persists. At the same time, miner-linked wallets showed a slight reduction in their average cost basis from $58,000 to $54,000, hinting at modest selling pressure from mining operations.
Long-term holders, meanwhile, remain well positioned, with a cost basis near $40,000. This region has historically been considered a strong accumulation zone , providing resilience during broader market corrections. BorisD pointed out that cost basis levels often track closely with price behavior and can act as both support and resistance during volatile swings.

Featured image created with DALL-E, Chart from TradingView

Analyst Forecasts Bitcoin Price Will Break This Support Level, Can $100,000 Hold?
The Bitcoin price is once again under heavy pressure in the market. An analyst has warned that the c...

This Dogecoin Squeeze Could Kickstart The Next Bull Run
Crypto analyst Unichartz has highlighted a Dogecoin squeeze that could spark the next massive move t...

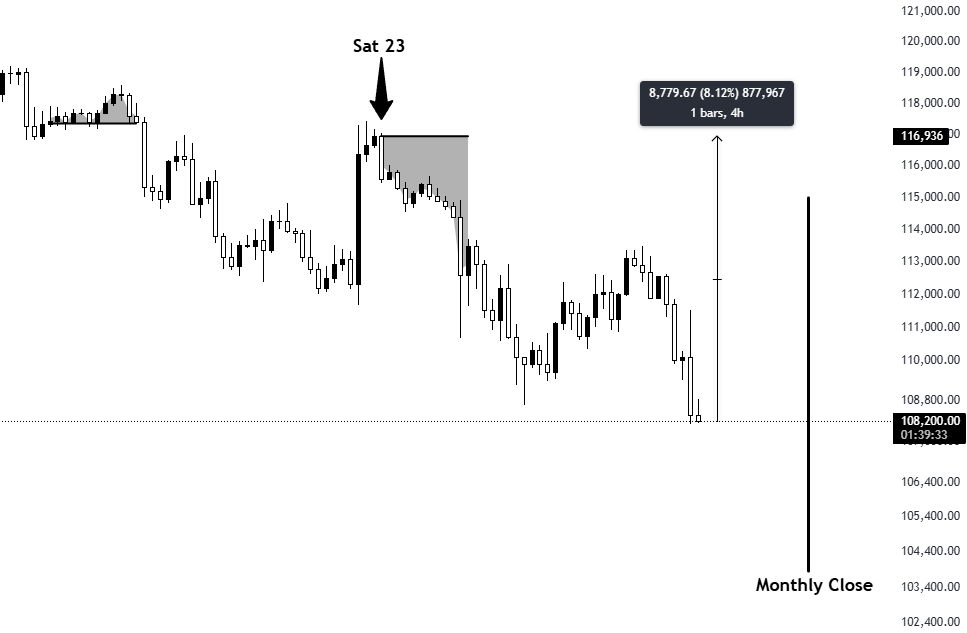
Bitcoin 8% Below CME Gap Ahead Of Monthly Close — Will History Repeat?
The Bitcoin market is presently consolidating around $108,000 following a rather turbulent trading w...

