Bitcoin Price Struggles to Rebound – Signs of a Bigger Crash Ahead?


Bitcoin price is showing bearish signs below $113,000. BTC is struggling to recover and might start another decline below the $110,500 zone.
- Bitcoin started a recovery wave from the $108,750 zone.
- The price is trading below $112,500 and the 100 hourly Simple moving average.
- There was a break above a key bearish trend line with resistance at $111,350 on the hourly chart of the BTC/USD pair (data feed from Kraken).
- The pair might start another increase if it clears the $113,000 resistance zone.
Bitcoin Price Attempts Fresh Increase
Bitcoin price extended losses after close below the $112,000 level. BTC gained bearish momentum and traded below the $111,500 support zone.
There was a move below the $110,500 support zone and the 100 hourly Simple moving average. The pair tested the $108,750 zone. A low was formed at $108,734 and the price recently started a recovery wave. There was a move above the $112,000 level.
The price surpassed the 23.6% Fib retracement level of the key drop from the $117,354 swing high to the $110,734 low. Besides, there was a break above a key bearish trend line with resistance at $111,350 on the hourly chart of the BTC/USD pair.
Bitcoin is now trading below $112,500 and the 100 hourly Simple moving average . Immediate resistance on the upside is near the $112,500 level. The first key resistance is near the $113,000 level or the 50% Fib retracement level of the key drop from the $117,354 swing high to the $110,734 low. The next resistance could be $114,000.
A close above the $114,000 resistance might send the price further higher. In the stated case, the price could rise and test the $115,000 resistance level. Any more gains might send the price toward the $115,500 level. The main target could be $116,500.
Another Decline In BTC?
If Bitcoin fails to rise above the $113,000 resistance zone, it could start a fresh decline. Immediate support is near the $110,600 level. The first major support is near the $109,500 level.
The next support is now near the $108,750 zone. Any more losses might send the price toward the $107,100 support in the near term. The main support sits at $105,500, below which BTC might accelerate lower.
Technical indicators:
Hourly MACD – The MACD is now losing pace in the bearish zone.
Hourly RSI (Relative Strength Index) – The RSI for BTC/USD is now below the 50 level.
Major Support Levels – $110,600, followed by $109,500.
Major Resistance Levels – $112,500 and $113,000.
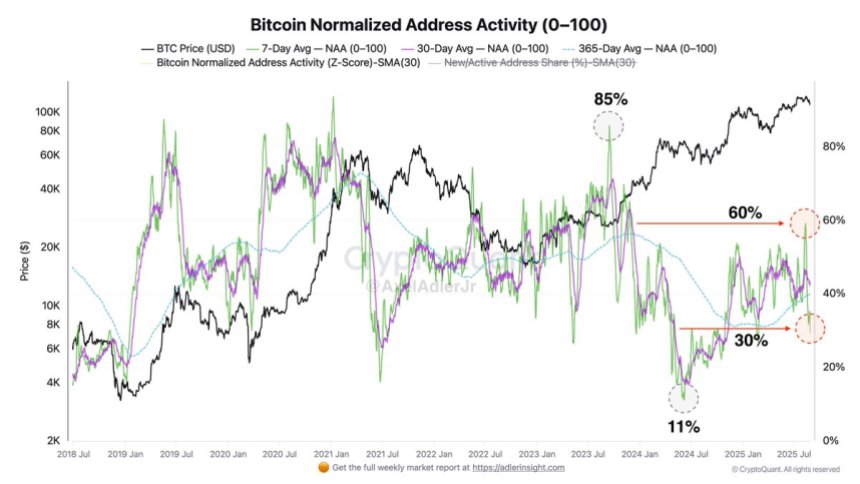
Bitcoin Normalized Address Activity Drops To 30%: Selling Pressure Eases
Bitcoin is trading at a critical level after successfully holding above $110,000 as support, but mar...
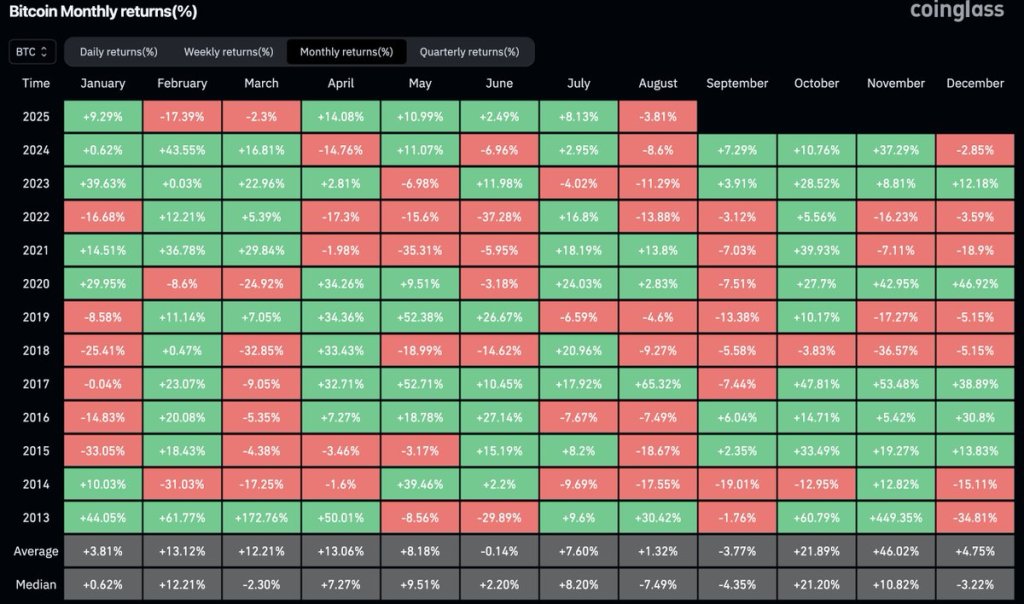
Bitcoin And The September Curse: Can This Time Be Different?
Bitcoin heads into the final days of August with choppy, two-way trade and a familiar seasonal quest...

Trump Media and Crypto.com Deal Sends Cronos Sky-High: These 3 Altcoins Could Be Next
In a surprising move, Trump Media and Technology Group Inc. and Crypto.com announced a landmark part...