Bitcoin Price Declines Further, Can Buyers Prevent Another Sharp Drop?


Bitcoin price is attempting to recover from $110,650. BTC is back above $112,200 but faces many hurdles on the way up to $115,000.
- Bitcoin started a recovery wave above the $112,000 zone.
- The price is trading below $114,000 and the 100 hourly Simple moving average.
- There is a key bearish trend line forming with resistance at $114,000 on the hourly chart of the BTC/USD pair (data feed from Kraken).
- The pair might start another increase if it clears the $114,500 resistance zone.
Bitcoin Price Dips Again
Bitcoin price started a fresh decline after a close below the $114,500 level. BTC gained bearish momentum and traded below the $113,200 support zone.
There was a move below the $112,000 support zone and the 100 hourly Simple moving average. The pair tested the $110,6500 zone. A low was formed at $110,692 and the price is now attempting to recover. It climbed above the 23.6% Fib retracement level of the recent decline from the $117,354 swing high to the $110,692 low.
Bitcoin is now trading below $114,000 and the 100 hourly Simple moving average . Immediate resistance on the upside is near the $113,600 level. The first key resistance is near the $114,000 level. There is also a key bearish trend line forming with resistance at $114,000 on the hourly chart of the BTC/USD pair.
The next resistance could be $114,800 or the 61.8% Fib retracement level of the recent decline from the $117,354 swing high to the $110,692 low. A close above the $114,800 resistance might send the price further higher.
In the stated case, the price could rise and test the $115,500 resistance level. Any more gains might send the price toward the $115,500 level. The main target could be $116,500.
Another Decline In BTC?
If Bitcoin fails to rise above the $114,000 resistance zone, it could start a fresh decline. Immediate support is near the $112,500 level. The first major support is near the $112,200 level.
The next support is now near the $111,500 zone. Any more losses might send the price toward the $110,650 support in the near term. The main support sits at $108,500, below which BTC might take a major hit.
Technical indicators:
Hourly MACD – The MACD is now losing pace in the bearish zone.
Hourly RSI (Relative Strength Index) – The RSI for BTC/USD is now below the 50 level.
Major Support Levels – $112,200, followed by $112,000.
Major Resistance Levels – $113,500 and $114,000.
This Altcoin Is A 12,500% Crypto Bet Until 2028, Says Arthur Hayes
BitMEX co-founder and crypto-legend Arthur Hayes used the main stage at Tokyo’s WebX 2025 to unveil ...
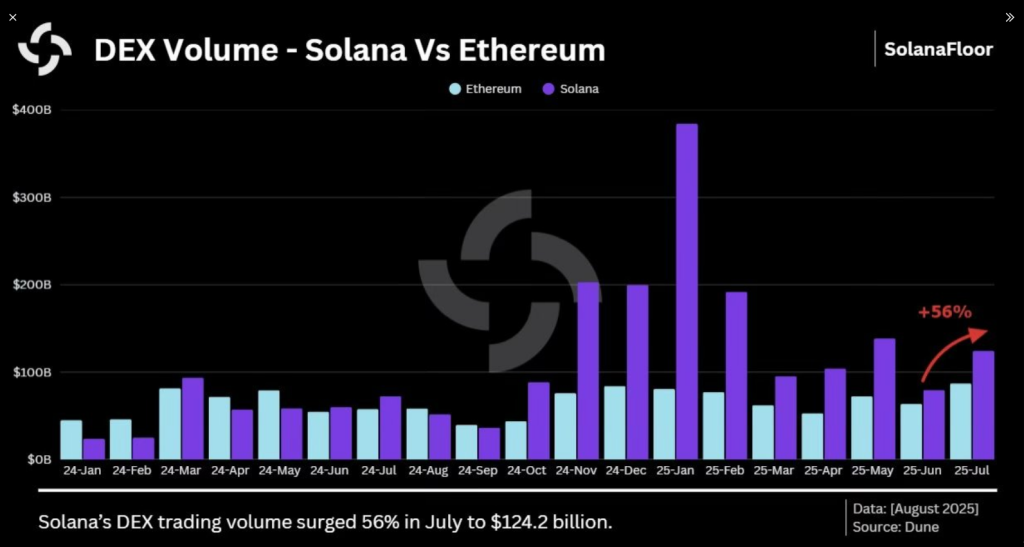
Solana Extends Streak, Outshines Ethereum in DEX Volume – Details
Solana is holding its dominance in decentralized finance with a striking performance in July. Report...
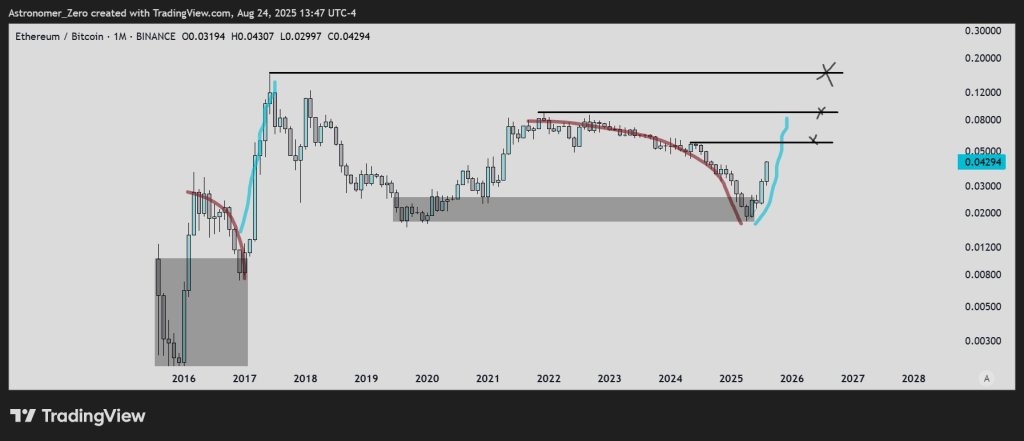
Can Ethereum Really Hit $20,000 This Cycle? Analyst Maps The Path
Crypto analyst Astronomer (@astronomer_zero) says his long-standing bottom thesis on the ETH/BTC pai...