XRP Price Declines Again, Key Support Tested as Risks Increase


XRP price is showing bearish signs below the $2.950 resistance zone. The price is struggling to recover and might decline further below $2.820.
- XRP price is declining below the $2.950 and $2.920 levels.
- The price is now trading below $2.920 and the 100-hourly Simple Moving Average.
- There is a bearish trend line forming with resistance at $2.910 on the hourly chart of the XRP/USD pair (data source from Kraken).
- The pair could continue to move down if it stays below the $3.00 zone.
XRP Price Remains At Risk
XRP price remained in a bearish zone after a close below the $3.00 level, like Bitcoin and Ethereum . The price extended losses and traded below the $2.920 support zone.
The price even declined below $2.850. Finally, it tested the $2.820 support zone. A low was formed at $2.820 and the price recently attempted a recovery wave. There was a move above the $2.90 level. The price climbed above the 50% Fib retracement level of the downward move from the $3.095 swing high to the $2.820 low.
However, the bears are active near the $3.00 zone and the 61.8% Fib retracement level of the downward move from the $3.095 swing high to the $2.820 low.
The price is now trading below $2.920 and the 100-hourly Simple Moving Average. On the upside, the price might face resistance near the $2.90 level. There is also a bearish trend line forming with resistance at $2.910 on the hourly chart of the XRP/USD pair.
The first major resistance is near the $2.950 level. A clear move above the $2.950 resistance might send the price toward the $3.00 resistance. Any more gains might send the price toward the $3.120 resistance. The next major hurdle for the bulls might be near $3.20.
More Losses?
If XRP fails to clear the $2.90 resistance zone, it could start a fresh decline. Initial support on the downside is near the $2.820 level. The next major support is near the $2.80 level.
If there is a downside break and a close below the $2.80 level, the price might continue to decline toward the $2.7650 support. The next major support sits near the $2.750 zone, below which the price could gain bearish momentum.
Technical Indicators
Hourly MACD – The MACD for XRP/USD is now gaining pace in the bearish zone.
Hourly RSI (Relative Strength Index) – The RSI for XRP/USD is now below the 50 level.
Major Support Levels – $2.820 and $2.7650.
Major Resistance Levels – $2.90 and $2.950.
Ethereum Vs. Solana: Arthur Hayes Picks His Winner For This Cycle
Arthur Hayes has a clear answer to the market’s favorite bar fight. In an August 21 interview with R...
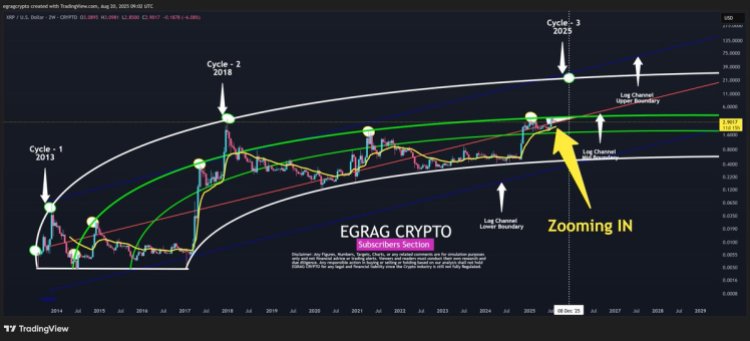
Analyst Puts XRP Cycle Top Above $20, But Says Price Must Hold Last Line Of Defense
Crypto analyst EGRAG CRYPTO has long been one of the most vocal bulls of XRP, calling for higher pri...
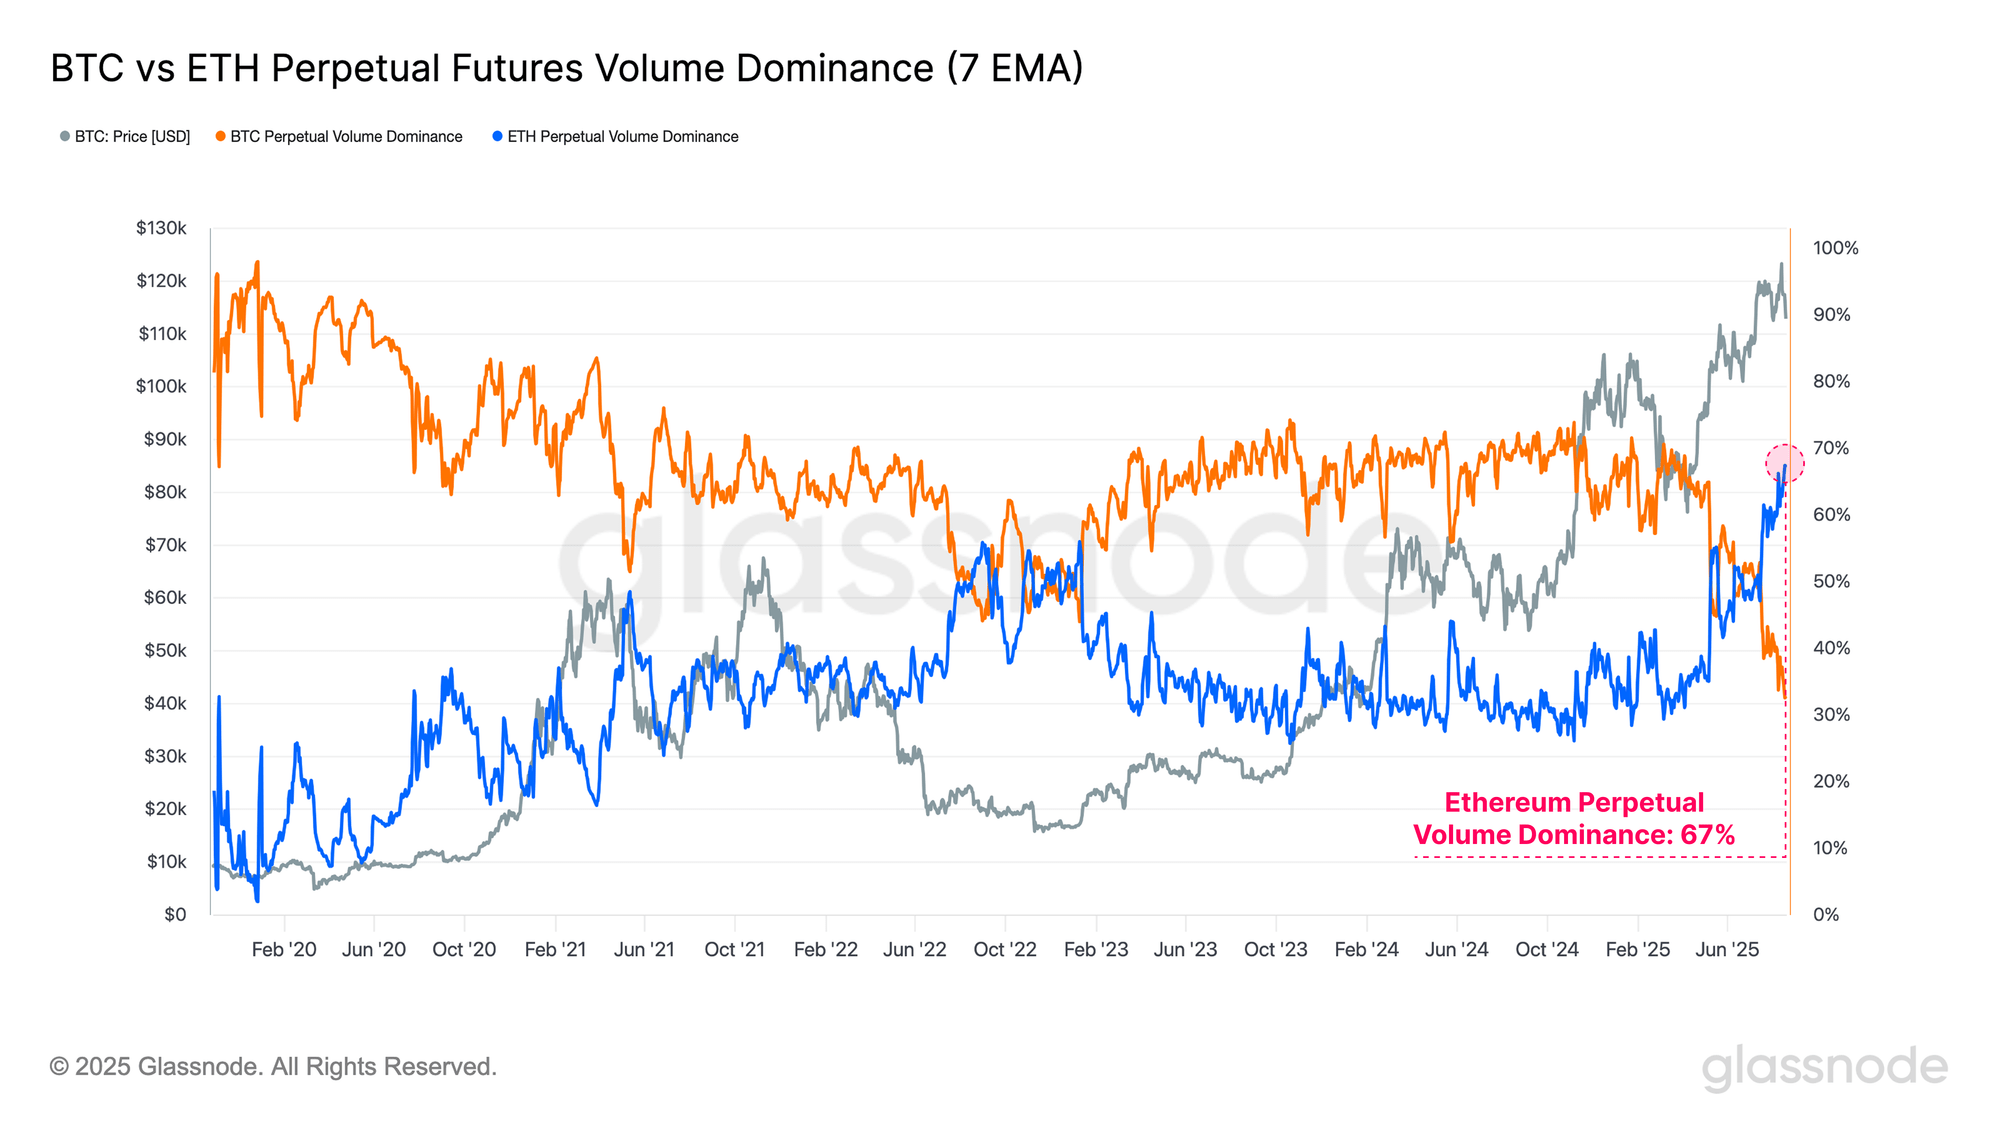
Altseason Things: Ethereum Perps Volume Sets New Record Against Bitcoin
Data shows the Ethereum perpetual futures volume dominance has set a new all-time high relative to B...