Bitcoin Price Eases From Highs—Bounce Back on the Horizon?


Bitcoin price is correcting gains from the $122,250 zone. BTC is now consolidating and might aim for a move toward the $120,500 resistance zone.
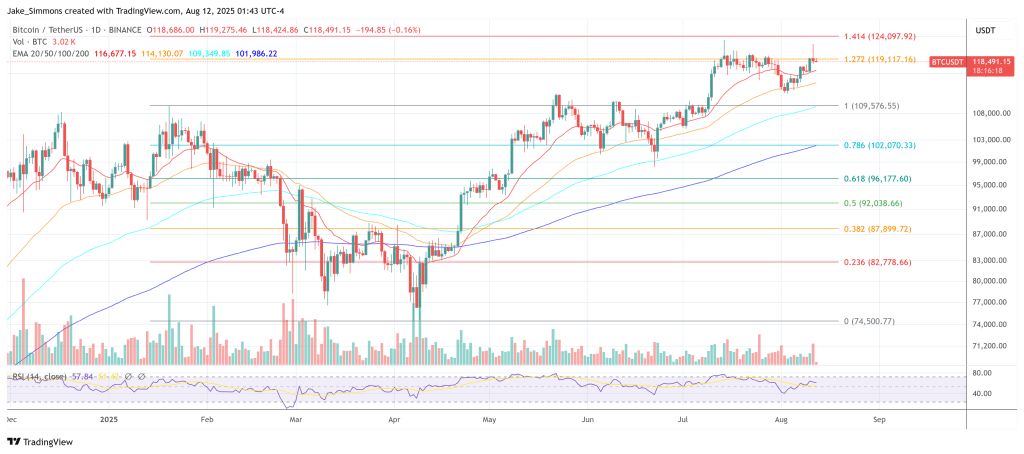
- Bitcoin started a fresh increase above the $118,500 zone.
- The price is trading above $118,000 and the 100 hourly Simple moving average.
- There was a break below a key bullish trend line with support at $119,500 on the hourly chart of the BTC/USD pair (data feed from Kraken).
- The pair might start another increase if it clears the $120,500 resistance zone.
Bitcoin Price Aims Fresh Increase
Bitcoin price found support near the $115,500 zone and started a fresh increase . BTC was able to climb above the $117,500 and $118,800 resistance levels.
The price even cleared the $120,500 resistance to move into a positive zone. Finally, the price tested the $122,250 resistance zone. A high was formed at $122,273 and the price recently corrected some gains. There was a move below the $120,500 level.
The price dipped below the 50% Fib retracement level of the upward move from the $116,282 swing low to the $122,273 high. Besides, there was a break below a key bullish trend line with support at $119,500 on the hourly chart of the BTC/USD pair.
Bitcoin is now trading above $118,000 and the 100 hourly Simple moving average . Immediate resistance on the upside is near the $119,250 level. The first key resistance is near the $120,500 level.
The next resistance could be $121,250. A close above the $121,250 resistance might send the price further higher. In the stated case, the price could rise and test the $123,200 resistance level. Any more gains might send the price toward the $124,000 level. The main target could be $125,000.
More Losses In BTC?
If Bitcoin fails to rise above the $120,500 resistance zone, it could start another decline. Immediate support is near the $118,200 level. The first major support is near the $117,800 level.
The next support is now near the $116,550 zone. Any more losses might send the price toward the $115,500 support in the near term. The main support sits at $113,500, below which BTC might continue to move down.
Technical indicators:
Hourly MACD – The MACD is now losing pace in the bullish zone.
Hourly RSI (Relative Strength Index) – The RSI for BTC/USD is now below the 50 level.
Major Support Levels – $118,200, followed by $116,550.
Major Resistance Levels – $119,250 and $120,500.

“Индиана Джонс криптомира”: как Майкл Сэйлор променял золото на биткоин
Майкл Сэйлор, известный сторонник Биткоина и сооснователь компании Strategy, снова использовал поп-к...
Jeff Bezos’ Blue Origin Now Takes Bitcoin, ETH, SOL For Spaceflights
Blue Origin will now sell New Shepard spaceflight seats in Bitcoin, Ethereum, Solana and selected do...

Pundit Predicts ‘Near Term’ Bitcoin And Ethereum Prices, There’s Still Room To Run
Bitcoin and Ethereum prices began to rally over the weekend, and interestingly, ETH was able to beat...