Solana (SOL) Coils for Upside Move – Will Resistance Give Way?


Solana started a fresh increase above the $162 zone. SOL price is now consolidating gains and might aim for more gains above the $172 zone.
- SOL price started a fresh upward move above the $160 and $162 levels against the US Dollar.
- The price is now trading above $162 and the 100-hourly simple moving average.
- There is a key bullish trend line forming with support at $165 on the hourly chart of the SOL/USD pair (data source from Kraken).
- The pair could start a fresh increase if it clears the $172 resistance zone.
Solana Price Eyes Fresh Move To $180
Solana price started a decent increase after it found support near the $155 zone, like Bitcoin and Ethereum . SOL climbed above the $160 level to enter a short-term positive zone.
The price even smashed the $162 resistance. The bulls were able to push the price above the 23.6% Fib retracement level of the downward move from the $182 swing high to the $155 low. There is also a key bullish trend line forming with support at $165 on the hourly chart of the SOL/USD pair.
Solana is now trading above $162 and the 100-hourly simple moving average. On the upside, the price is facing resistance near the $170 level. It is close to the 50% Fib retracement level of the downward move from the $182 swing high to the $155 low.
The next major resistance is near the $172 level. The main resistance could be $180. A successful close above the $180 resistance zone could set the pace for another steady increase. The next key resistance is $182. Any more gains might send the price toward the $192 level.
Are Downsides Supported In SOL?
If SOL fails to rise above the $172 resistance, it could start another decline. Initial support on the downside is near the $165 zone and the trend line. The first major support is near the $162 level.
A break below the $162 level might send the price toward the $155 support zone. If there is a close below the $150 support, the price could decline toward the $145 support in the near term.
Technical Indicators
Hourly MACD – The MACD for SOL/USD is gaining pace in the bullish zone.
Hourly Hours RSI (Relative Strength Index) – The RSI for SOL/USD is above the 50 level.
Major Support Levels – $165 and $162.
Major Resistance Levels – $172 and $182.

Network Stability Or Miner Pullback? Bitcoin Mining Difficulty Stagnates In 2025
Bitcoin mining difficulty has hit the brakes in 2025. For the first time in the network’s history, d...
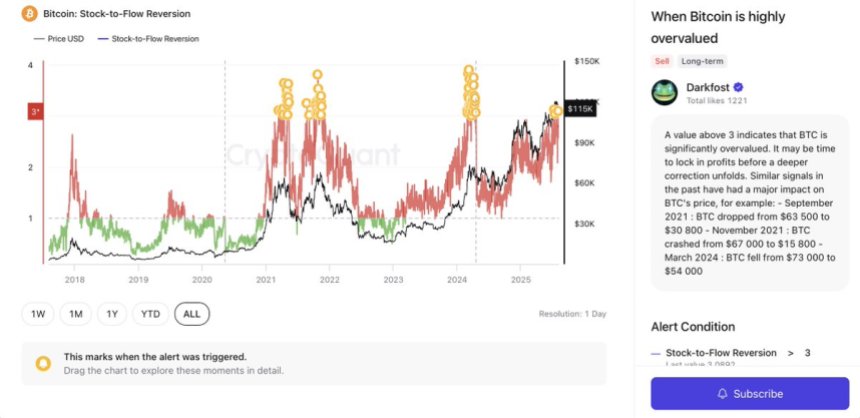
Is Bitcoin Overheated? Key Signal Flashes Warning Similar To 2021 And 2024 Market Tops
Bitcoin is undergoing a sharp correction after losing the $115K support level, triggering a wave of ...
Market Expert Debunks Possible Bitcoin Top In November Using 9-12 Months Retail Cycle
The debate around Bitcoin’s top for this cycle has been a major topic as market participants eye pot...