Bitcoin Price Eyes $123K Explosion—Traders Brace for Breakout


Bitcoin price is attempting a fresh increase above $120,000. BTC is now consolidating and might attempt a steady move toward the $125,000 zone.
- Bitcoin started a fresh increase from the $115,800 zone.
- The price is trading above $119,000 and the 100 hourly Simple moving average.
- There was a break above a bearish trend line with resistance at $119,000 on the hourly chart of the BTC/USD pair (data feed from Kraken).
- The pair might start another increase if it clears the $120,500 resistance zone.
Bitcoin Price Eyes Fresh Upward Move
Bitcoin price started a correction from the new high at $123,200. BTC dipped below the $120,000 level and tested the $115,500 zone.
A low was formed at $115,730 and the price is now attempting a fresh increase. The bulls were above to push the price above the $118,000 and $118,500 resistance levels. There was a move above the 50% Fib retracement level of the move from the $123,140 swing high to the $115,730 low.
Besides, there was a break above a bearish trend line with resistance at $119,000 on the hourly chart of the BTC/USD pair. Bitcoin is now trading above $119,500 and the 100 hourly Simple moving average .
Immediate resistance on the upside is near the $120,200 level. The first key resistance is near the $121,400 level. It is close to the 76.4% Fib retracement level of the move from the $123,140 swing high to the $115,730 low. The next resistance could be $123,150.
A close above the $123,150 resistance might send the price further higher. In the stated case, the price could rise and test the $124,200 resistance level. Any more gains might send the price toward the $125,000 level. The main target could be $126,200.
Another Decline In BTC?
If Bitcoin fails to rise above the $121,400 resistance zone, it could start another decline. Immediate support is near the $119,000 level and the 100 hourly SMA. The first major support is near the $117,500 level.
The next support is now near the $115,500 zone. Any more losses might send the price toward the $113,500 support in the near term. The main support sits at $110,500, below which BTC might continue to move down.
Technical indicators:
Hourly MACD – The MACD is now losing pace in the bullish zone.
Hourly RSI (Relative Strength Index) – The RSI for BTC/USD is now above the 50 level.
Major Support Levels – $117,500, followed by $115,500.
Major Resistance Levels – $121,400 and $123,150.
XRP and Dogecoin Skyrocket as U.S. Crypto Bills Pass — Here’s Why Everyone’s Hunting for the Best Crypto to Buy
Major cryptocurrencies led by $XRP and $DOGE have rallied in the past 24 hours as the market eagerly...
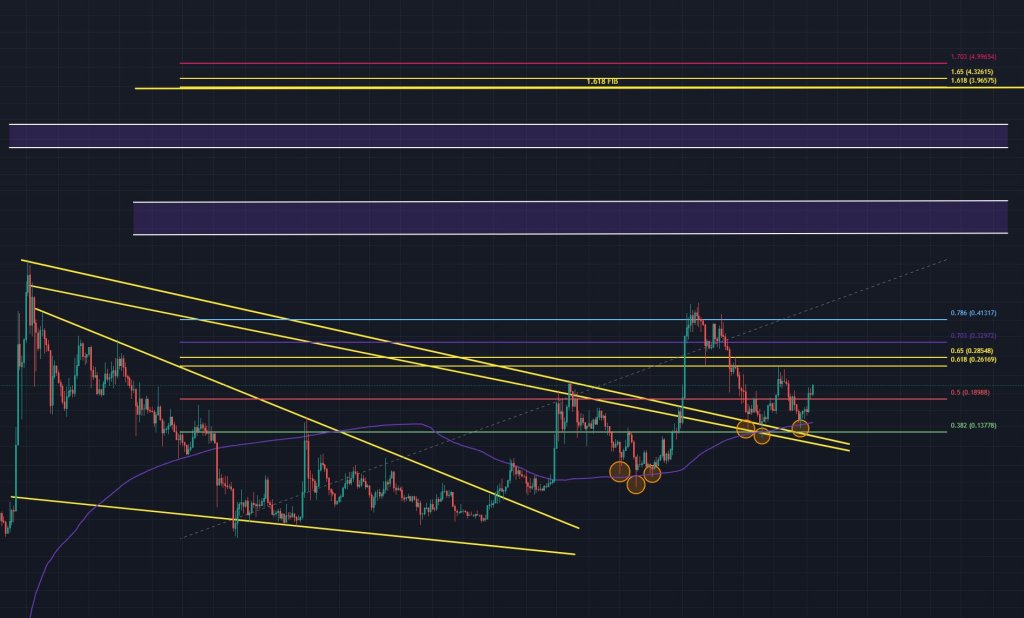
Dogecoin Price Prediction: Expect 60% Liftoff If This Channel Breaks: Analyst
Crypto analyst MMBTtrader has predicted that the Dogecoin price could record a 60% rally from its cu...
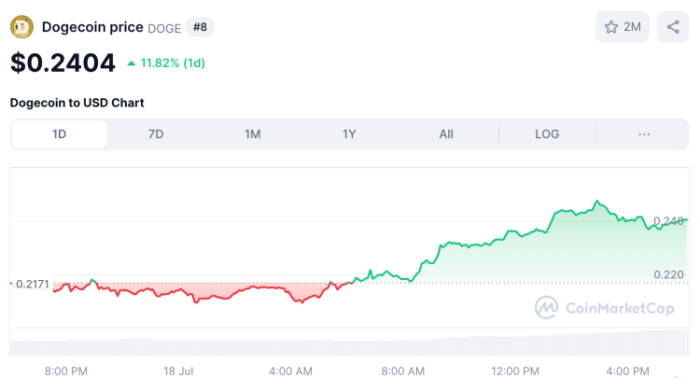
Dogecoin Erupts Past $0.23—Analyst Predicts Next Price Targets
The latest burst of momentum has carried the Dogecoin price through the psychologically significant ...