XRP Price Strengthens — Eyes Set on Key Resistance Levels


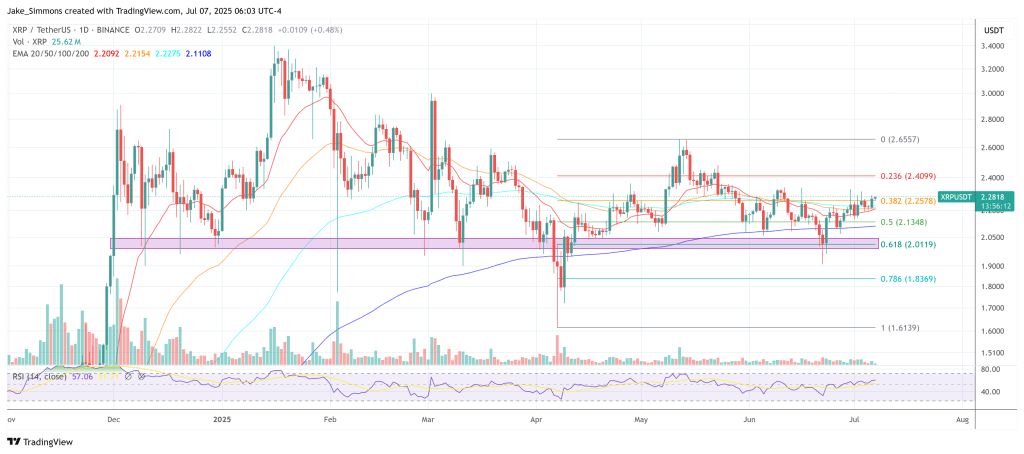
XRP price started a decent upward move from the $2.20 zone. The price is now showing positive signs and might aim for a move above the $2.285 resistance.
- XRP price started a fresh increase above the $2.2320 zone.
- The price is now trading above $2.2320 and the 100-hourly Simple Moving Average.
- There is a short-term contracting triangle forming with resistance at $2.280 on the hourly chart of the XRP/USD pair (data source from Kraken).
- The pair could start another increase if it clears the $2.280 zone.
XRP Price Faces Resistance
XRP price started a fresh increase after it settled above the $2.220 level, like Bitcoin and Ethereum . The price was able to climb above the $2.2320 resistance level.
The bulls were able to push the price above the $2.250 level. Moreover, there was a clear move above the 61.8% Fib retracement level of the downward move from the $2.3111 swing high to the $2.197 low. The price is now trading above $2.250 and the 100-hourly Simple Moving Average.
On the upside, the price might face resistance near the $2.280 level. There is also a short-term contracting triangle forming with resistance at $2.280 on the hourly chart of the XRP/USD pair.
The first major resistance is near the $2.2850 level. It is close to the 76.4% Fib retracement level of the downward move from the $2.3111 swing high to the $2.197 low. The next resistance is $2.320. A clear move above the $2.320 resistance might send the price toward the $2.350 resistance. Any more gains might send the price toward the $2.40 resistance or even $2.420 in the near term. The next major hurdle for the bulls might be $2.50.
Another Decline?
If XRP fails to clear the $2.2850 resistance zone, it could start another decline. Initial support on the downside is near the $2.260 level. The next major support is near the $2.2320 level.
If there is a downside break and a close below the $2.2320 level, the price might continue to decline toward the $2.20 support. The next major support sits near the $2.150 zone.
Technical Indicators
Hourly MACD – The MACD for XRP/USD is now gaining pace in the bullish zone.
Hourly RSI (Relative Strength Index) – The RSI for XRP/USD is now above the 50 level.
Major Support Levels – $2.2320 and $2.20.
Major Resistance Levels – $2.2850 and $2.320.
XRP Set To Shock The Crypto Market With 30% Share, Analyst Predicts
XRP’s market dominance may be on the verge of a historic breakout, with analyst Cryptoinsightuk (@Cr...
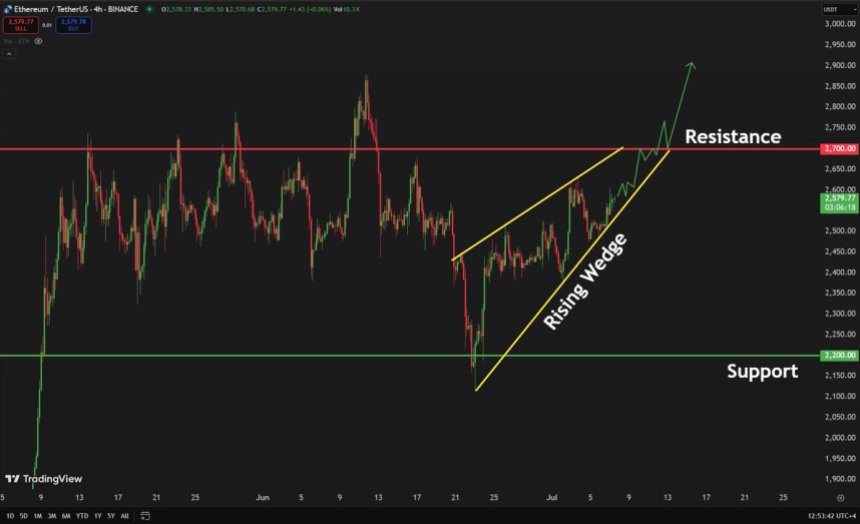
Ethereum Risks Downside If Resistance Holds: $2,700 Level Is Critical
Ethereum is trading above the $2,500 level, showing notable strength despite recent volatility acros...
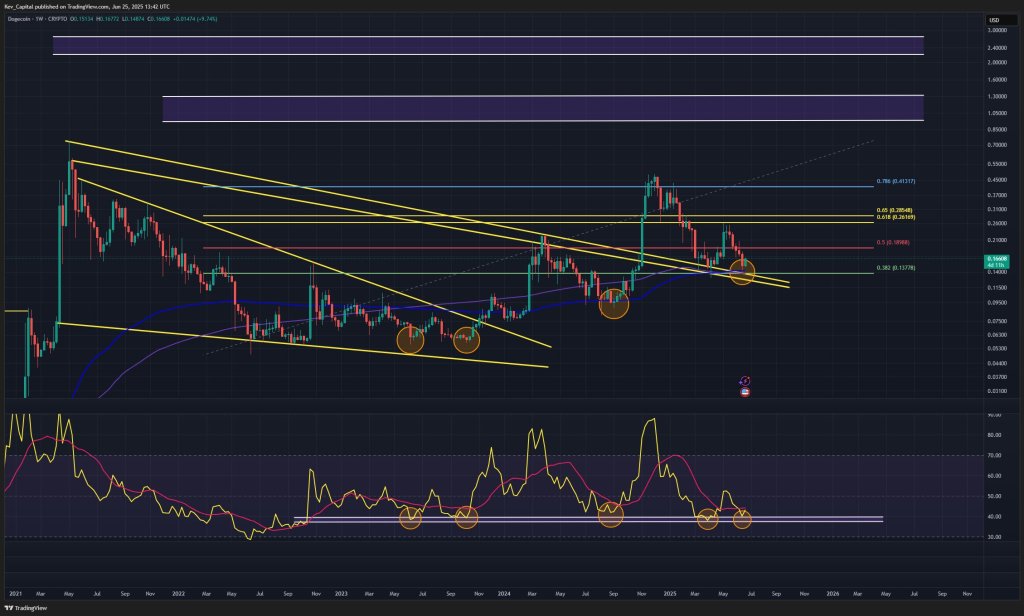
Chartist Slams Misleading Dogecoin Analysis: ‘Focus On This Instead’
Technical analyst Kevin, better known on X as @Kev_Capital_TA, rekindled debate over Dogecoin’s mark...