Solana (SOL) Cools After Recovery — Resistance Proving Difficult to Crack


Solana started a recovery wave above the $150 zone. SOL price is now correcting gains and might struggle to rise above the $155 resistance.
- SOL price started a fresh decline after it failed to clear $155 against the US Dollar.
- The price is now trading near $152 and the 100-hourly simple moving average.
- There is a key bullish trend line forming with support at $151 on the hourly chart of the SOL/USD pair (data source from Kraken).
- The pair could start a fresh increase if it clears the $156 resistance zone.
Solana Price Trims Gains
Solana price started a decent increase after it cleared the $150 resistance, like Bitcoin and Ethereum . SOL climbed above the $152 level to enter a short-term positive zone. There was a move above the 50% Fib retracement level of the downward move from the $160 swing high to the $144 low.
However, the bears were active near the $156 resistance. They protected a move above the 76.4% Fib retracement level of the downward move from the $160 swing high to the $144 low.
The price is now moving lower and trading below the $154 level. Solana is now trading near $152 and the 100-hourly simple moving average. There is also a key bullish trend line forming with support at $151 on the hourly chart of the SOL/USD pair.
On the upside, the price is facing resistance near the $155 level. The next major resistance is near the $156 level. The main resistance could be $160. A successful close above the $160 resistance zone could set the pace for another steady increase. The next key resistance is $162. Any more gains might send the price toward the $165 level.
Another Decline in SOL?
If SOL fails to rise above the $155 resistance, it could start another decline. Initial support on the downside is near the $150 zone. The first major support is near the $146 level.
A break below the $146 level might send the price toward the $142 zone. If there is a close below the $142 support, the price could decline toward the $136 support in the near term.
Technical Indicators
Hourly MACD – The MACD for SOL/USD is losing pace in the bullish zone.
Hourly Hours RSI (Relative Strength Index) – The RSI for SOL/USD is below the 50 level.
Major Support Levels – $150 and $146.
Major Resistance Levels – $155 and $160.
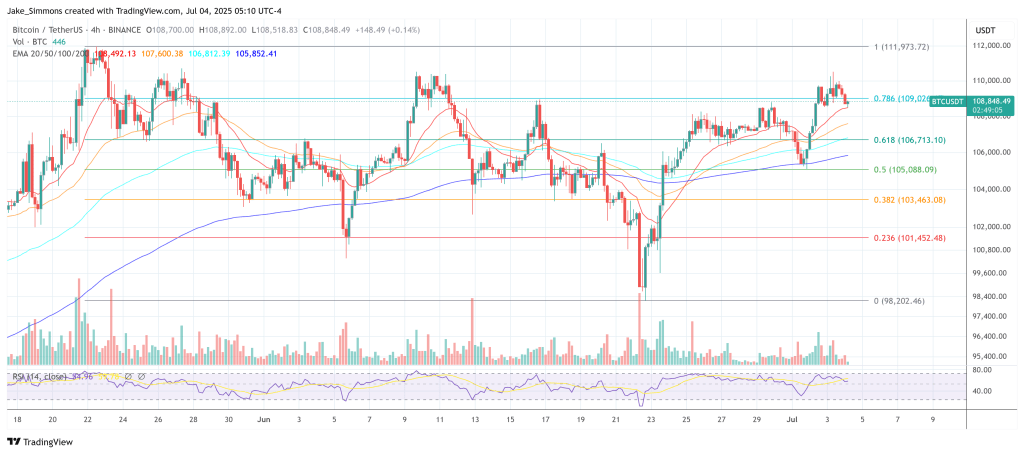
Bitcoin Breakout Is A Trap—Analyst Predicts Pain Before $160,000 Surge
Bitcoin may be breaking out—but don’t celebrate yet. Crypto analyst Cristian Chifoi warns that the c...
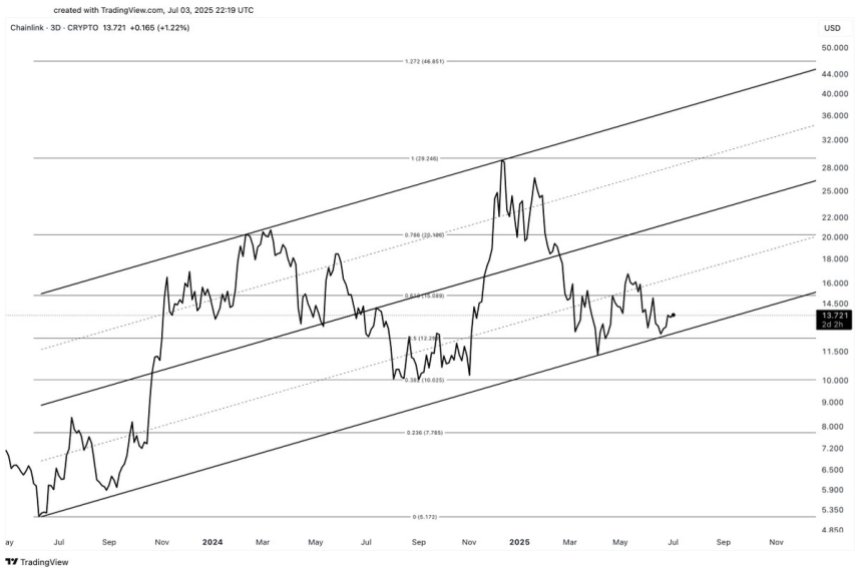
Chainlink Consolidates Above Key Support – Bulls Eye $20 Range
Chainlink (LINK) has been locked in a consolidation phase since early March, following a prolonged p...

Snaky Way ($AKE) Explodes Into Presale with AI Buybacks, Influencer Partnerships & Blockchain Games
The cryptocurrency landscape is always evolving, with new projects popping up to capture the attenti...