XRP Price Retreats From Highs — Is The Rally In Jeopardy?


XRP price started a fresh decline from the $2.320 zone. The price is now correcting gains and might find bids near the $2.120 zone.
- XRP price started a fresh decline from the $2.320 zone.
- The price is now trading below $2.220 and the 100-hourly Simple Moving Average.
- There was a break below a key bullish trend line with support at $2.20 on the hourly chart of the XRP/USD pair (data source from Kraken).
- The pair could extend losses if it fails to clear the $2.220 resistance zone.
XRP Price Dips Further
XRP price failed to extend gains above the $2.320 resistance and started a fresh decline, like Bitcoin and Ethereum . The price declined below the $2.250 and $2.220 support levels.
Besides, there was a break below a key bullish trend line with support at $2.20 on the hourly chart of the XRP/USD pair. The pair even spiked below the $2.150 level. A low was formed at $2.148 and the price is now consolidating losses below the 23.6% Fib retracement level of the downward move from the $2.327 swing high to the $2.148 low.
The price is now trading below $2.220 and the 100-hourly Simple Moving Average. On the upside, the price might face resistance near the $2.20 level. The first major resistance is near the $2.220 level. The next resistance is $2.2380. It is close to the 50% Fib retracement level of the downward move from the $2.327 swing high to the $2.148 low.
A clear move above the $2.2380 resistance might send the price toward the $2.2850 resistance. Any more gains might send the price toward the $2.30 resistance or even $2.320 in the near term. The next major hurdle for the bulls might be $2.40.
Fresh Decline?
If XRP fails to clear the $2.220 resistance zone, it could start another decline. Initial support on the downside is near the $2.150 level. The next major support is near the $2.120 level.
If there is a downside break and a close below the $2.120 level, the price might continue to decline toward the $2.050 support. The next major support sits near the $2.020 zone.
Technical Indicators
Hourly MACD – The MACD for XRP/USD is now losing pace in the bearish zone.
Hourly RSI (Relative Strength Index) – The RSI for XRP/USD is now below the 50 level.
Major Support Levels – $2.150 and $2.120.
Major Resistance Levels – $2.220 and $2.2850.
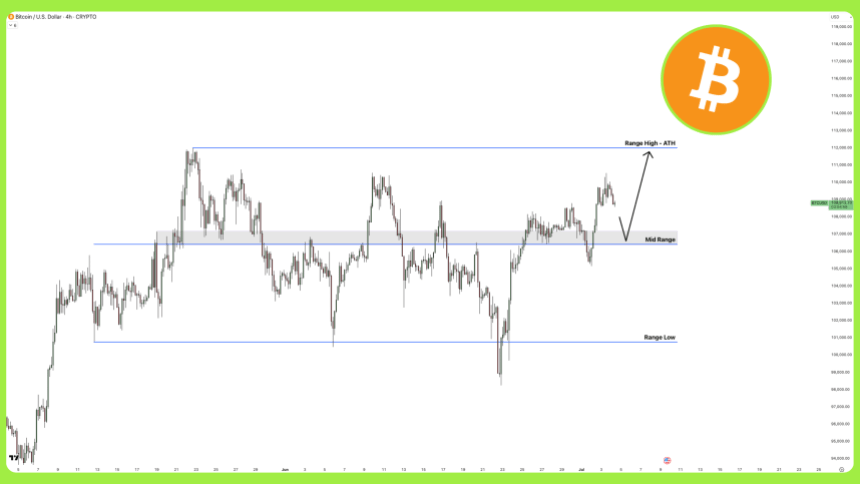
Bitcoin Near Historic Weekly Close Despite Drop – Analyst Warns Of Volatile Weekend
As the market sees a Friday retrace, Bitcoin (BTC) is attempting to reclaim a crucial area as suppor...
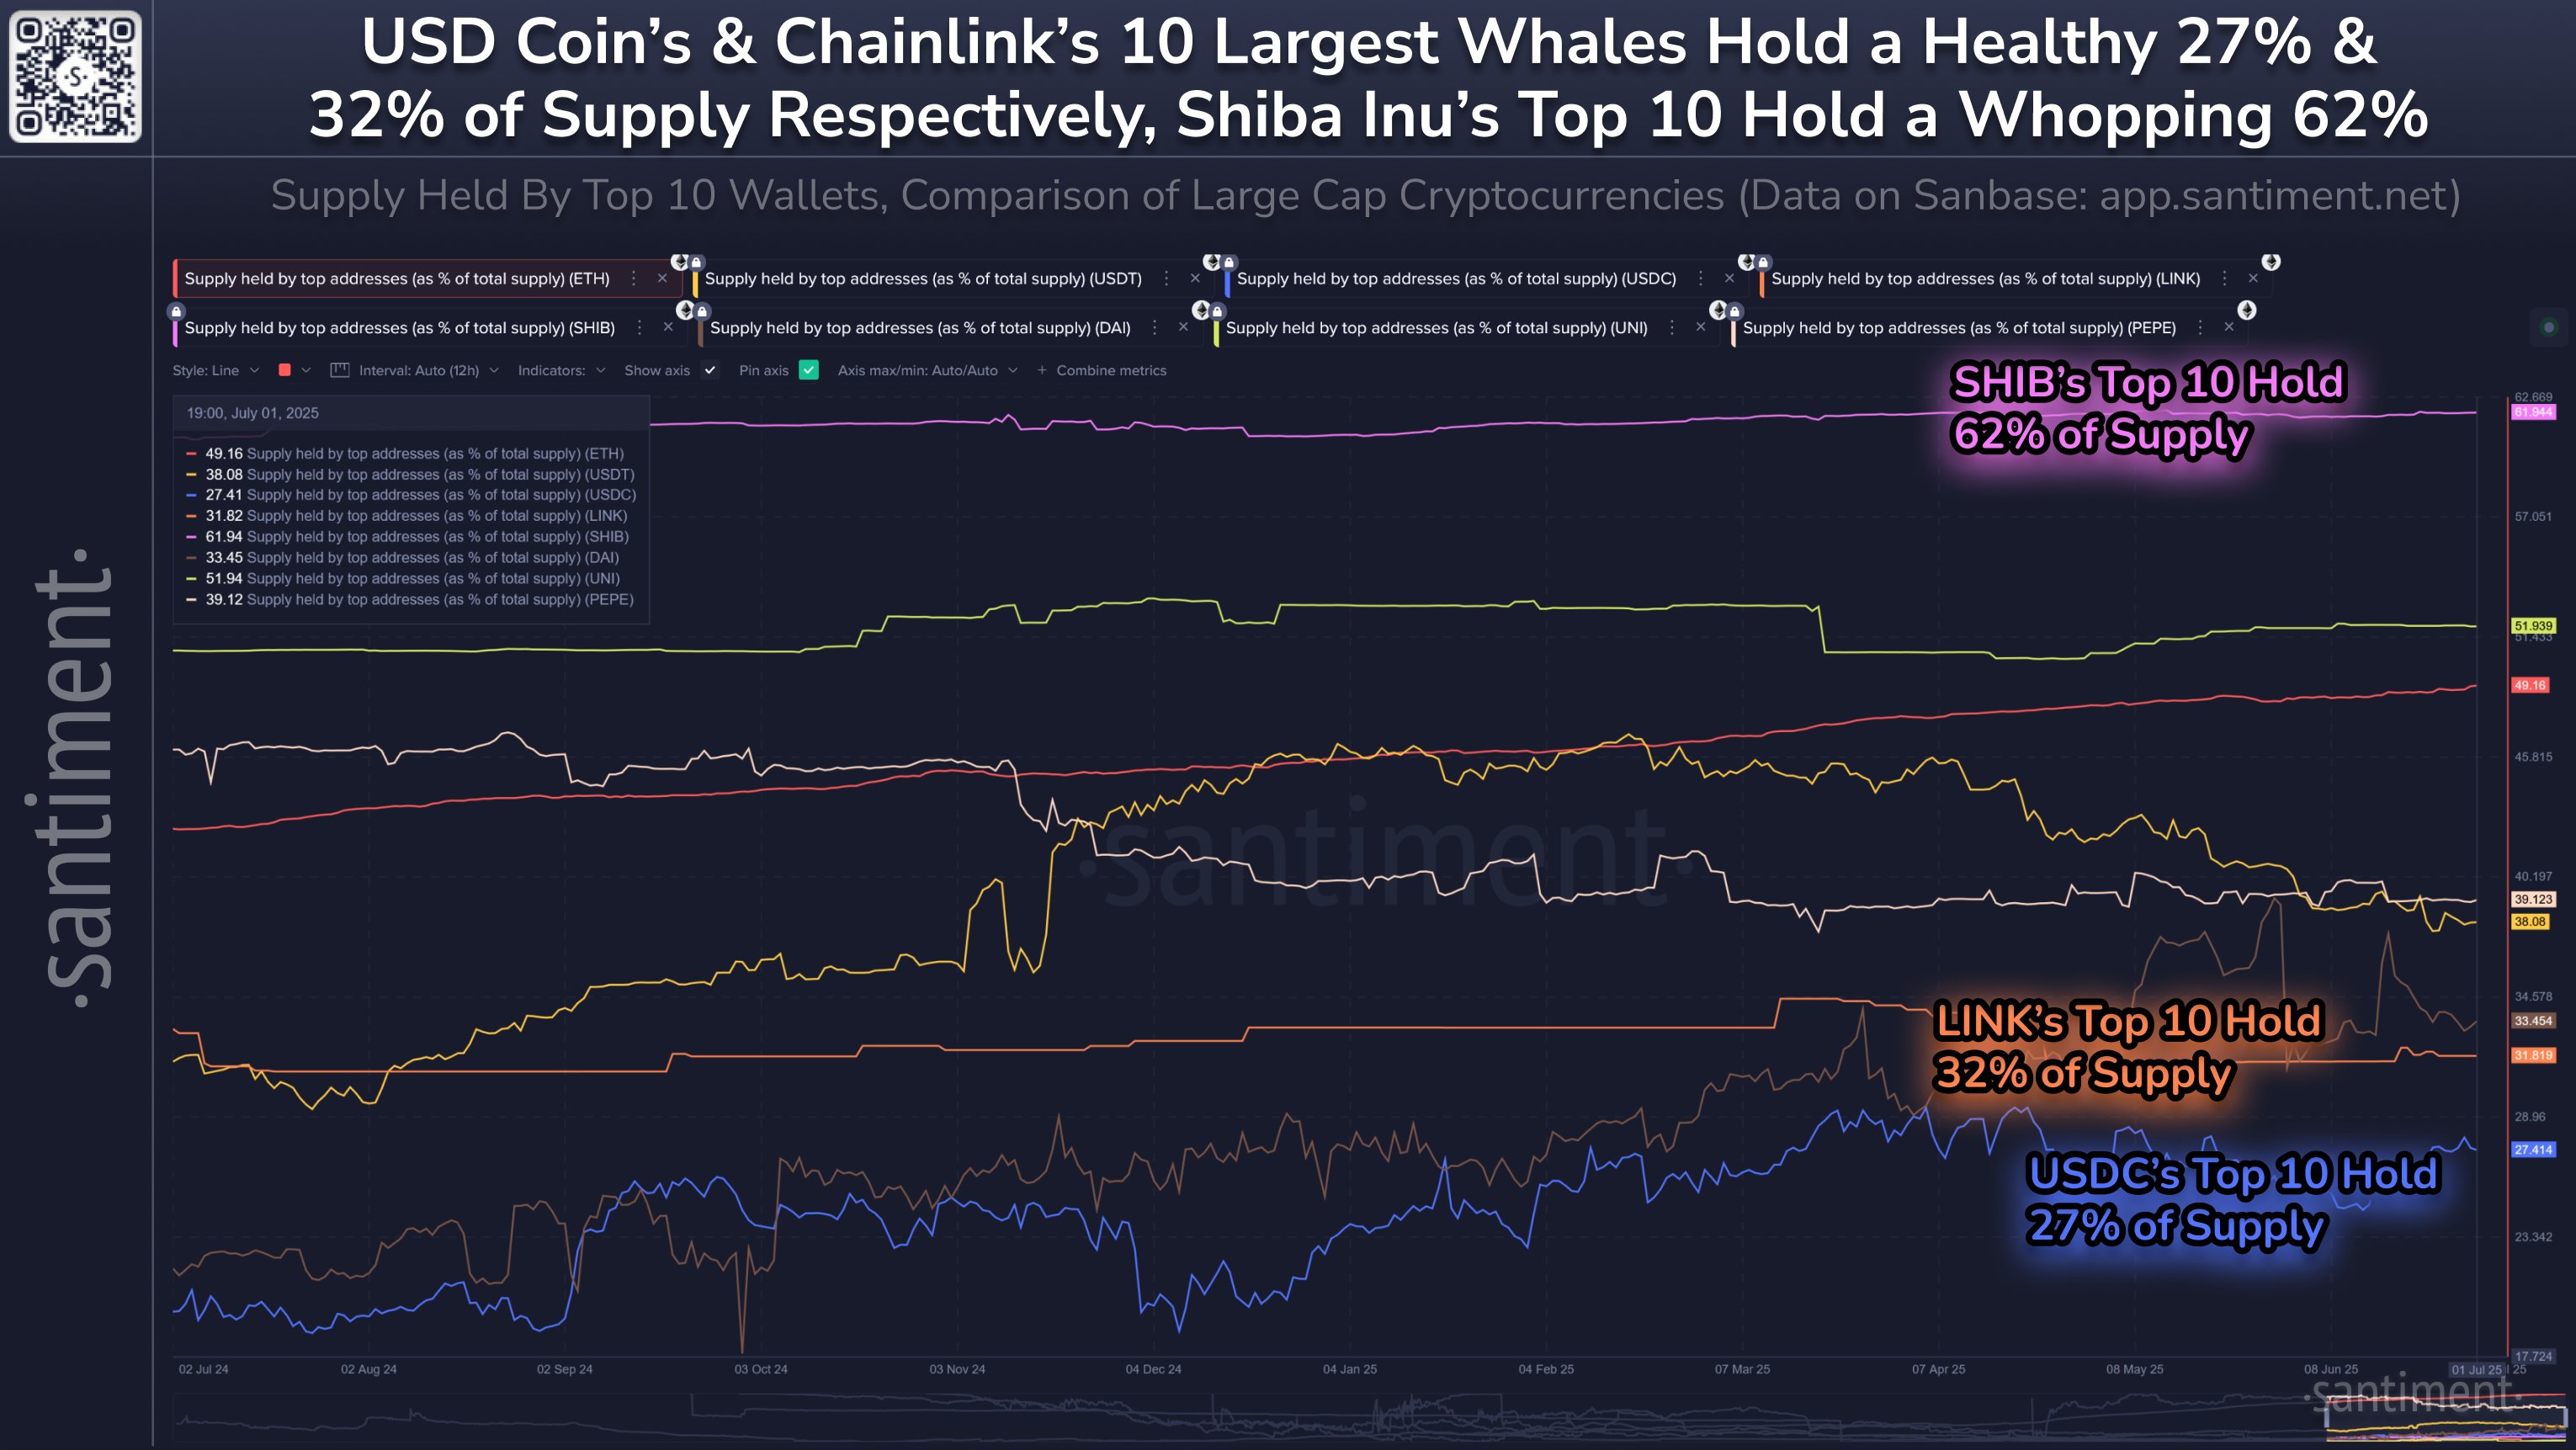
Shiba Inu Supply Most Centralized Among Top Coins—62% Held By Just 10 Whales
On-chain data shows Shiba Inu (SHIB) has its supply more concentrated on the largest holders than ot...
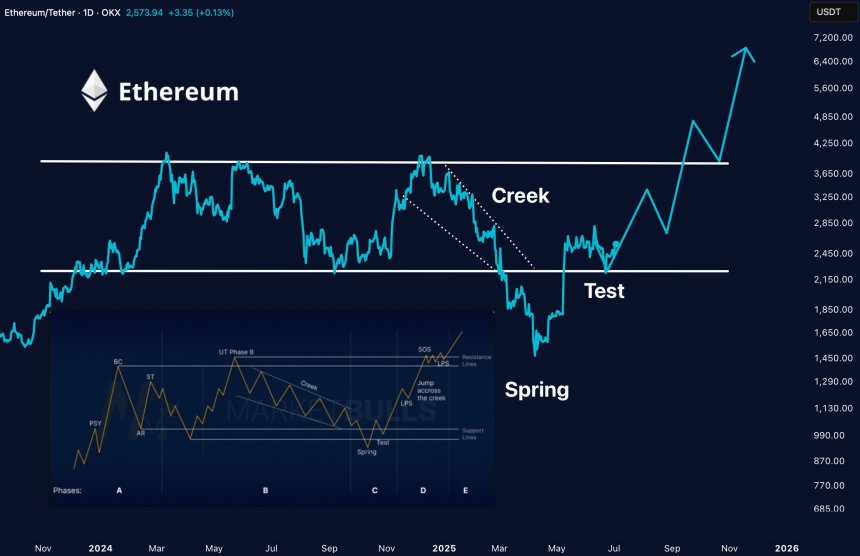
Ethereum Approaches Wyckoff ‘Liftoff’ Phase – Can ETH Reach A New High?
Ethereum (ETH) is up 4.2% over the past seven days, trading in the mid-$2,500 range at the time of w...