XRP Price Surges, Then Cools — Will Bulls Return for Round Two?


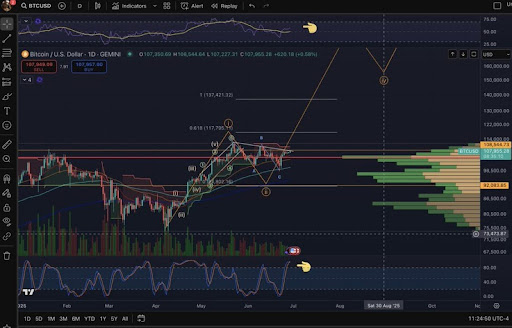
XRP price started a steady increase above the $2.220 zone. The price is now correcting gains and might find bids near the $2.20 zone.
- XRP price started a fresh increase above the $2.220 zone.
- The price is now trading above $2.180 and the 100-hourly Simple Moving Average.
- There is a key bullish trend line forming with support at $2.20 on the hourly chart of the XRP/USD pair (data source from Kraken).
- The pair could gain bullish momentum if it clears the $2.280 resistance zone.
XRP Price Regains Traction
XRP price formed a base above the $2.120 level and started a fresh increase, beating Bitcoin and Ethereum . The price was able to climb above the $2.180 and $2.20 resistance levels.
The pair even surged above the $2.30 level. A high was formed at $2.327 and the price is now correcting gains. There was a move below the $2.280 level. It dipped below the 50% Fib retracement level of the upward move from the $2.165 swing low to the $2.327 high.
The price is now trading above $2.180 and the 100-hourly Simple Moving Average. Besides, there is a key bullish trend line forming with support at $2.20 on the hourly chart of the XRP/USD pair. It is close to the 76.4% Fib retracement level of the upward move from the $2.165 swing low to the $2.327 high.
On the upside, the price might face resistance near the $2.280 level. The first major resistance is near the $2.30 level. The next resistance is $2.320. A clear move above the $2.320 resistance might send the price toward the $2.350 resistance.
Any more gains might send the price toward the $2.40 resistance or even $2.450 in the near term. The next major hurdle for the bulls might be $2.50.
Fresh Decline?
If XRP fails to clear the $2.280 resistance zone, it could start another decline. Initial support on the downside is near the $2.220 level. The next major support is near the $2.20 level.
If there is a downside break and a close below the $2.20 level, the price might continue to decline toward the $2.150 support. The next major support sits near the $2.120 zone.
Technical Indicators
Hourly MACD – The MACD for XRP/USD is now losing pace in the bullish zone.
Hourly RSI (Relative Strength Index) – The RSI for XRP/USD is now above the 50 level.
Major Support Levels – $2.220 and $2.20.
Major Resistance Levels – $2.280 and $2.320.
Here’s What Will Happen If The Bitcoin Price Can Manage A Clean Break Above $108,500
A crypto analyst has forecasted a powerful Wave 3 Bitcoin price rally that could take it toward new ...
GameStop Inspired a Lingerie MMA League to Buy Bitcoin: SUBBD Token Soars?
Shaun Donelly knows a hot item when he sees one – and Bitcoin’s the hottest item of them all. The CE...

BitMine Stock Soars 700% After $250 Million Raise For Ethereum Treasury
Tom Lee, the market strategist known for his insightful predictions on Bitcoin (BTC) and broader cry...