Whale Accumulation Hits Six-Year High as Ethereum Eyes $4K Breakout


- Ethereum whales acquired almost 1 million ETH on a single day, which was the largest one-day aggregation since 2018.
- Exchange reserves remain at multi-year lows, with staking and long-term holding rising.
- A surge above $2,700 might signal a surge towards $4,000; however, rejection could give rise to a revisit of the 2,000 level.
On-chain data shows that Ethereum whales took out almost 1 million ETH on a day, the largest daily acquisition since 2018. This massive spike is preceded by a tendency towards increased confidence among investors despite all the current uncertainty in the market.
As of writing, Ethereum has declined by 2% to close at $2,533, following a 10% weekly correction. Nevertheless, the magnitude of this whale hoarding is an indication of a breakout revival.
According to the Glassnode chart, there is a distinct increasing pattern in ETH holdings by addresses with 1,000 to 10,000 Ether. These addresses have now totaled approximately 14 million ETH, breaking multi-year loss trends.
The move comes as staking has recently exploded with more than 35 million ETH currently locked, representing 28.3% of the supply. Strikingly, in June, there were over 500,000 ETH staked.
Supply Dwindles as Long-Term Holders Step In
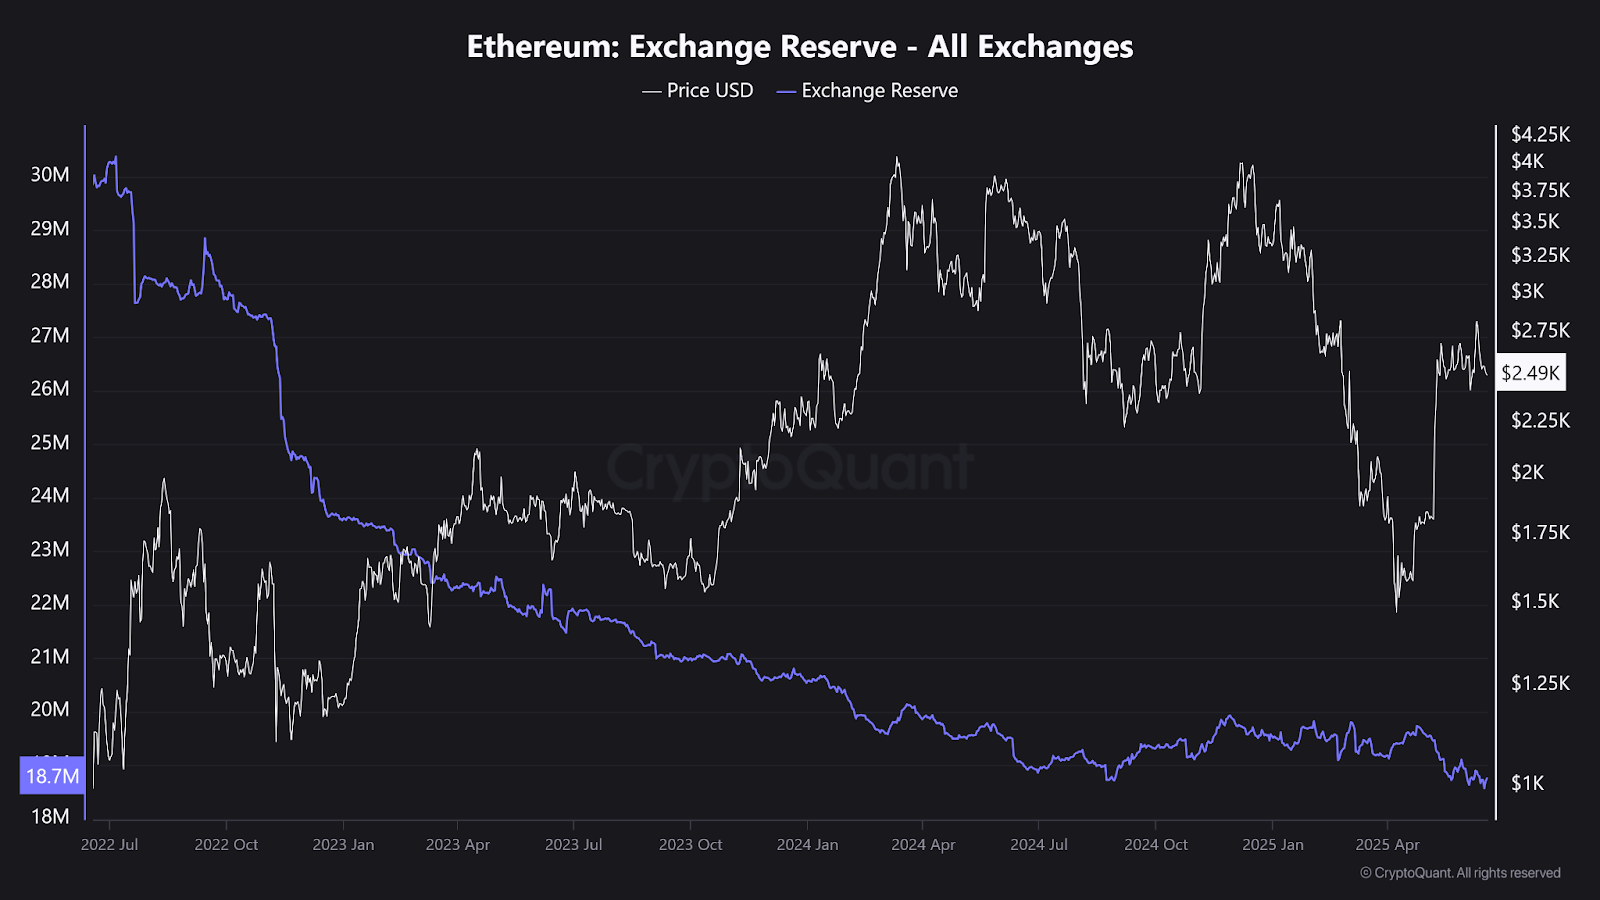
Ethereum reserves on centralized exchanges are currently down to 18.7 million ETH, the lowest since years. This current outflow, which has been witnessed by CryptoQuant data, is an increasing long-term holding trend. The exchange netflows have been negative, and this flow has been steady, indicating that more ETH has been leaving exchanges than entering.

Addresses with no history of selling now control an all-time high of 22.8 million ETH. This behavior, coupled with increased staking and whale buys, indicates reduced selling pressure in the short term. When exchange reserves fall while price stabilizes, it often points to suppressed sell-side liquidity, potentially setting the stage for a supply squeeze if demand rises.

Breakout Imminent or Another Rejection?
The 50-week exponential moving average (EMA) is now the focus, currently ranging between $2,650 and $2,700. ETH has repeatedly been unable to create a close above this level. However, historical breakouts of this area have led to rallies of 25% to 135%, according to crypto analyst İbrahim COŞAR.
Should Ethereum break this mark, a technical forecast indicates that the first major objective would be at the price of $4,000. This price also coincides with the upper end of a long-term bullish flag pattern. In an upswing, more bullish Fibonacci extension levels are at prices of $5,817 and $8,549.
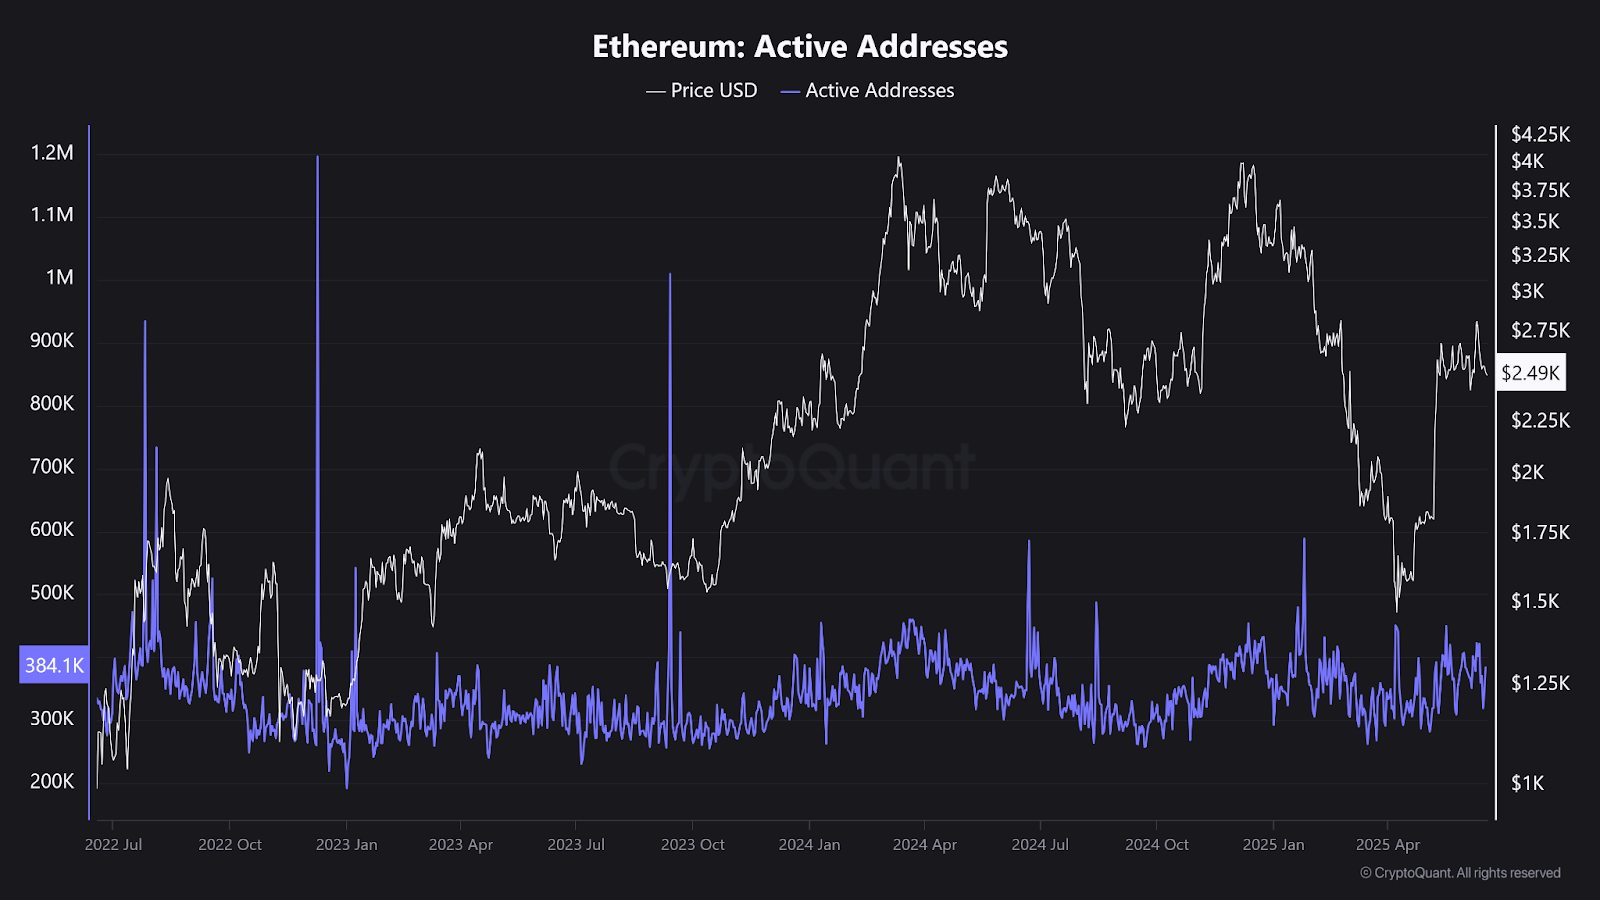
However, the inability to break the 50-week EMA may trigger a pullback to the support at the $2,000-$2,050 marks, which also correlates with the 0.786 Fibonacci retracement level and past support. The on-chain data indicates that the active addresses are at moderate numbers of about 384,000, which could require an uptick in order to maintain an upward trend of data.

Magic Square.io Joins Metis HyperHack, Hackathon with $200K Prize Pool and AI-driven Web3 on Hyperion
Magic Square.io joined the hacking program hosted by Metis. The hackathon invites developers to buil...

Dogecoin, PEPE, and MAGACOIN Lead Meme Coin Buzz as Social Engagement Surges
Dogecoin, PEPE, and MAGACOIN top meme coin social rankings as engagement surges, with GIGA and SHIB ...

Crypto Whale Makes Big Move: $2.45M in MakerDAO Tokens Sent to Exchange
One of the largest crypto whales on the platform, with a wallet address of 0x411…F11, has been trans...


 Technical breakout target for