Bitcoin Price Stumbles at Resistance — Will the Dip Deepen?


Bitcoin price started a fresh decline below the $106,800 zone. BTC is now consolidating and facing resistance near the $106,200 zone.
- Bitcoin started a fresh decline below the $106,200 zone.
- The price is trading below $106,800 and the 100 hourly Simple moving average.
- There is a short-term triangle forming with support at $104,200 on the hourly chart of the BTC/USD pair (data feed from Kraken).
- The pair could start a fresh increase if it stays above the $103,500 zone.
Bitcoin Price Dips Again
Bitcoin price started a fresh decline after it failed to clear the $108,800 resistance zone . BTC dipped below the $108,000 and $107,000 levels.
There was a clear move below the $106,200 support level. Finally, the price tested the $103,500 zone. A low was formed at $103,400 and the price is now consolidating losses. There was a minor increase above the 23.6% Fib retracement level of the downward move from the $108,924 swing high to the $103,400 low.
Bitcoin is now trading below $106,800 and the 100 hourly Simple moving average . Besides, there is a short-term triangle forming with support at $104,200 on the hourly chart of the BTC/USD pair.
On the upside, immediate resistance is near the $105,200 level. The first key resistance is near the $105,500 level. The next key resistance could be $106,200. It is near the 50% Fib retracement level of the downward move from the $108,924 swing high to the $103,400 low.
A close above the $106,200 resistance might send the price further higher. In the stated case, the price could rise and test the $108,000 resistance level. Any more gains might send the price toward the $110,000 level.
More Losses In BTC?
If Bitcoin fails to rise above the $106,200 resistance zone, it could start another decline. Immediate support is near the $104,200 level. The first major support is near the $103,500 level.
The next support is now near the $102,500 zone. Any more losses might send the price toward the $101,200 support in the near term. The main support sits at $100,000, below which BTC might gain bearish momentum.
Technical indicators:
Hourly MACD – The MACD is now losing pace in the bearish zone.
Hourly RSI (Relative Strength Index) – The RSI for BTC/USD is now below the 50 level.
Major Support Levels – $104,200, followed by $103,500.
Major Resistance Levels – $105,500 and $106,200.
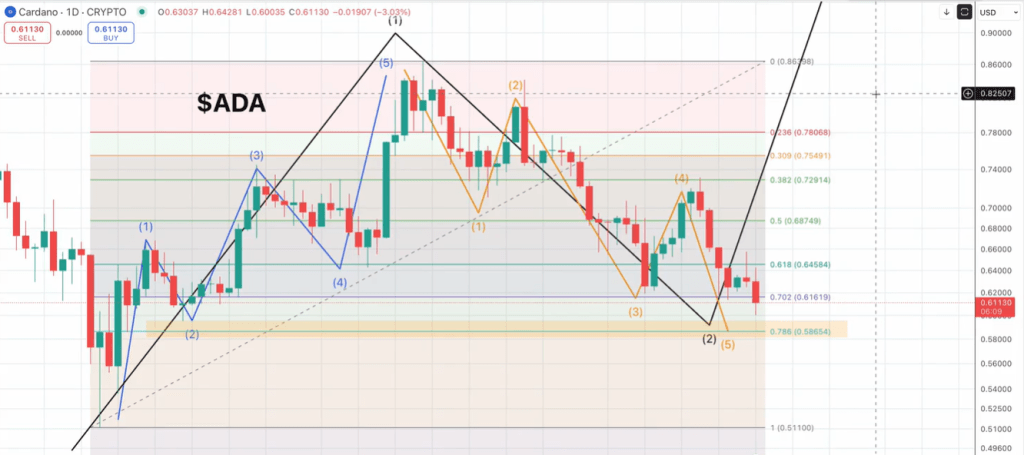
How Low Can Cardano Go? Analyst Maps Final Crash Before Resolution
After more than five weeks of unrelenting downside pressure, Cardano (ADA) finds itself approaching ...
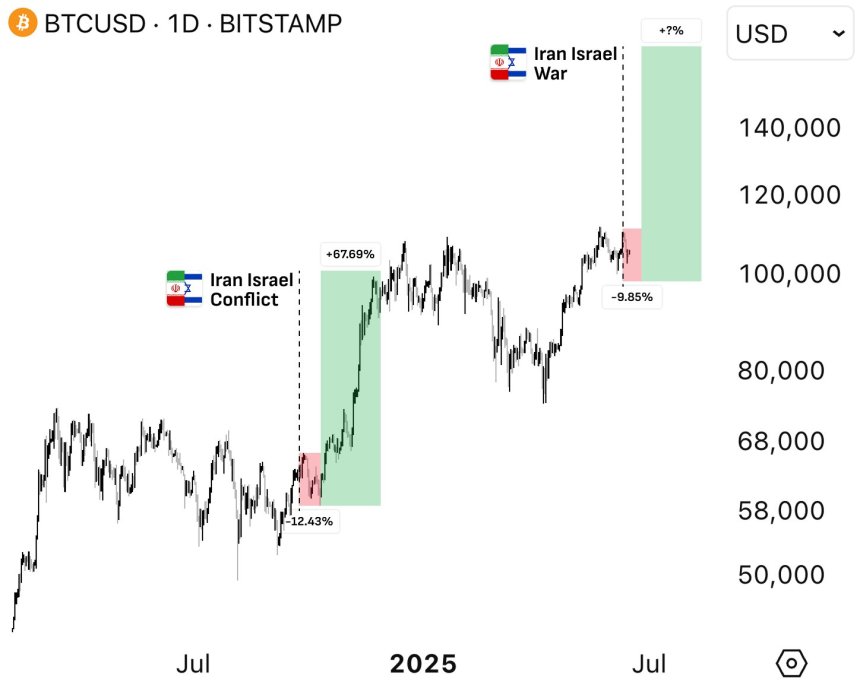
Crypto’s Unlikely Ally: Top Analyst Reveals War As A Surprising Bullish Force
Crypto analyst Cyclop has made a potentially significant statement, claiming that the ongoing crisis...
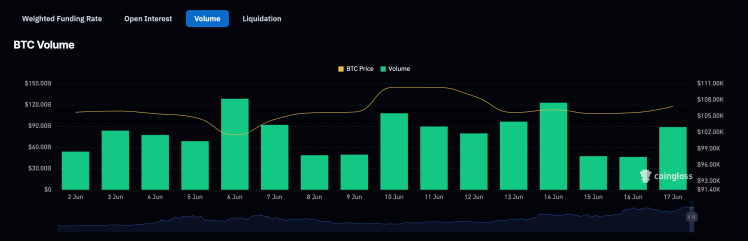
Bitcoin Volume Surges 100% Amid War Threats – What To Expect
Amid the chaos that was sparked by Israel’s attack on Iran, Bitcoin has climbed again, shaking off t...