XRP Price Takes a Breather—Consolidation Phase or Bullish Setup?


XRP price started a fresh increase above the $2.265 zone. The price is now consolidating and might aim for an upward move above the $2.30 resistance.
- XRP price started a decent upward move above the $2.250 zone.
- The price is now trading above $2.250 and the 100-hourly Simple Moving Average.
- There is a bullish trend line forming with support at $2.2750 on the hourly chart of the XRP/USD pair (data source from Kraken).
- The pair might start another increase if it clears the $2.30 resistance zone.
XRP Price Consolidates Gains
XRP price formed a base and started a fresh increase from the $2.10 zone, like Bitcoin and Ethereum . There was a move above the $2.150 and $2.20 resistance levels.
The bulls even pushed the price above the $2.25 level. Finally, the price tested the $2.320 resistance. A high was formed at $2.3294 and the price is now correcting some gains. There was a move below the 23.6% Fib retracement level of the upward move from the $2.2250 swing low to the $2.3294 high.
The price is now trading above $2.250 and the 100-hourly Simple Moving Average. There is also a bullish trend line forming with support at $2.2750 on the hourly chart of the XRP/USD pair.
On the upside, the price might face resistance near the $2.30 level. The first major resistance is near the $2.320 level. The next resistance is $2.350. A clear move above the $2.350 resistance might send the price toward the $2.40 resistance. Any more gains might send the price toward the $2.420 resistance or even $2.450 in the near term. The next major hurdle for the bulls might be $2.50.
Downside Break?
If XRP fails to clear the $2.30 resistance zone, it could start another decline. Initial support on the downside is near the $2.2750 level and the trend line. The next major support is near the $2.250 level and the 76.4% Fib retracement level of the upward move from the $2.2250 swing low to the $2.3294 high.
If there is a downside break and a close below the $2.250 level, the price might continue to decline toward the $2.220 support. The next major support sits near the $2.20 zone.
Technical Indicators
Hourly MACD – The MACD for XRP/USD is now losing pace in the bullish zone.
Hourly RSI (Relative Strength Index) – The RSI for XRP/USD is now below the 50 level.
Major Support Levels – $2.2750 and $2.250.
Major Resistance Levels – $2.30 and $2.320.
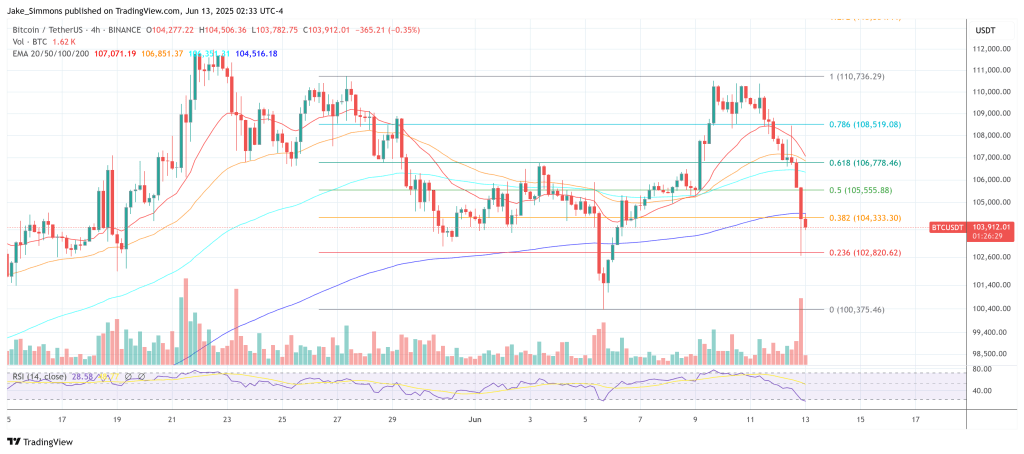
Bitcoin Price Crashes Below $103,000—What Triggered It?
After hitting $110,450 on Monday, the Bitcoin price is writing its third consecutive red day as the ...

Coinbase, Shopify to Simplify Real-World Crypto Payments: Best Wallet to Join the Fray with Fiat Card
Crypto exchange Coinbase announced that it will launch its Coinbase One Card later this fall. To be ...
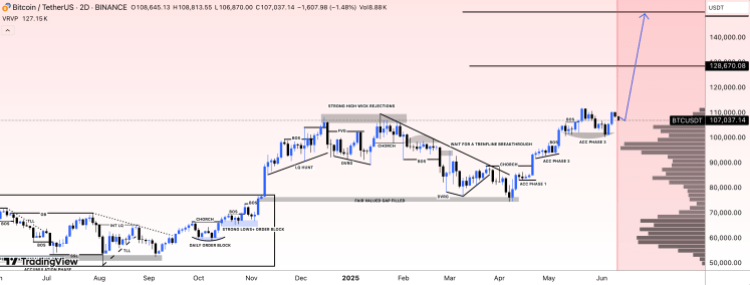
Bitcoin Bears Back In Control After $110,000 Rejection, What Comes Next?
The Bitcoin price has suffered a violent rejection after hitting the $110,000 level, showing a clear...