XRP Price Consolidates Before Liftoff — Is a Breakout on the Horizon?


XRP price started a consolidation phase above the $2.320 zone. The price is now rising and might aim for an upside break above $2.450.
- XRP price started a decent increase above the $2.3650 zone.
- The price is now trading above $2.380 and the 100-hourly Simple Moving Average.
- There is a connecting bullish trend line forming with support at $2.3580 on the hourly chart of the XRP/USD pair (data source from Kraken).
- The pair might start another increase if it clears the $2.450 resistance.
XRP Price Eyes Steady Increase
XRP price started a fresh downside correction in a range and traded below the $2.380 zone, unlike Bitcoin and Ethereum . There was a move below the $2.3650 and $2.350 levels. The price tested the $2.3350 zone.
A low was formed at $2.33360 and the price is now moving higher. There was a move above the $2.350 and $2.3650 levels. The price cleared the 50% Fib retracement level of the downward move from the $2.4315 swing high to the $2.3360 high.
The price is now trading above $2.38 and the 100-hourly Simple Moving Average. There is also a connecting bullish trend line forming with support at $2.3580 on the hourly chart of the XRP/USD pair.
On the upside, the price might face resistance near the $2.410 level. It is close to the 76.4% Fib retracement level of the downward move from the $2.4315 swing high to the $2.3360 high. The first major resistance is near the $2.4320 level.
The next resistance is $2.450. A clear move above the $2.450 resistance might send the price toward the $2.50 resistance. Any more gains might send the price toward the $2.550 resistance or even $2.5650 in the near term. The next major hurdle for the bulls might be $2.650.
Another Decline?
If XRP fails to clear the $2.450 resistance zone, it could start another decline. Initial support on the downside is near the $2.3650 level. The next major support is near the $2.3580 level and the trend line
If there is a downside break and a close below the $2.3580 level, the price might continue to decline toward the $2.320 support. The next major support sits near the $2.2650 zone.
Technical Indicators
Hourly MACD – The MACD for XRP/USD is now gaining pace in the bullish zone.
Hourly RSI (Relative Strength Index) – The RSI for XRP/USD is now above the 50 level.
Major Support Levels – $2.3580 and $2.320.
Major Resistance Levels – $2.420 and $2.450.
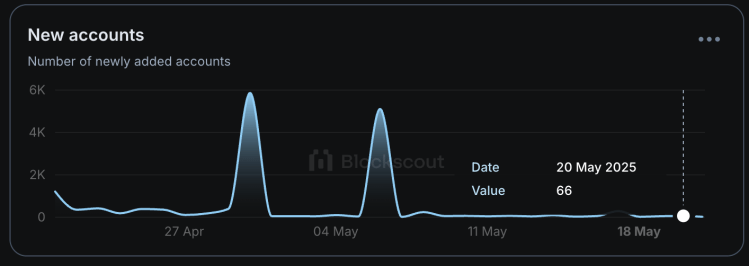
Shiba Inu’s Shibarium Struggles As New Accounts Crash To Fresh Lows
Following its launch by the Shiba Inu team back in August 2023, the Shibarium network has been subje...
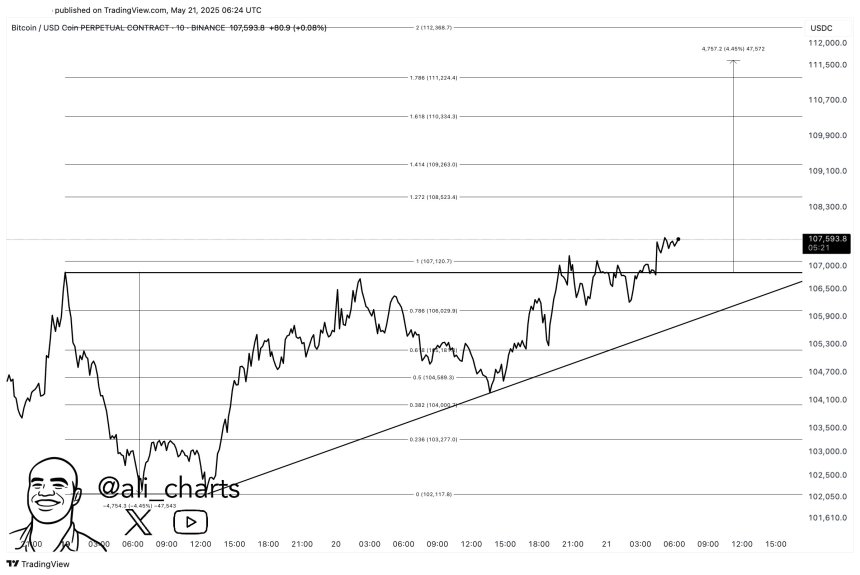
Bitcoin Ready For Second ‘Price Discovery Uptrend’ Following $109,000 Breakout – What’s Ahead For BTC?
Bitcoin (BTC) has hit a new all-time high (ATH) after a 4% daily breakout above the $109,000 mark. A...
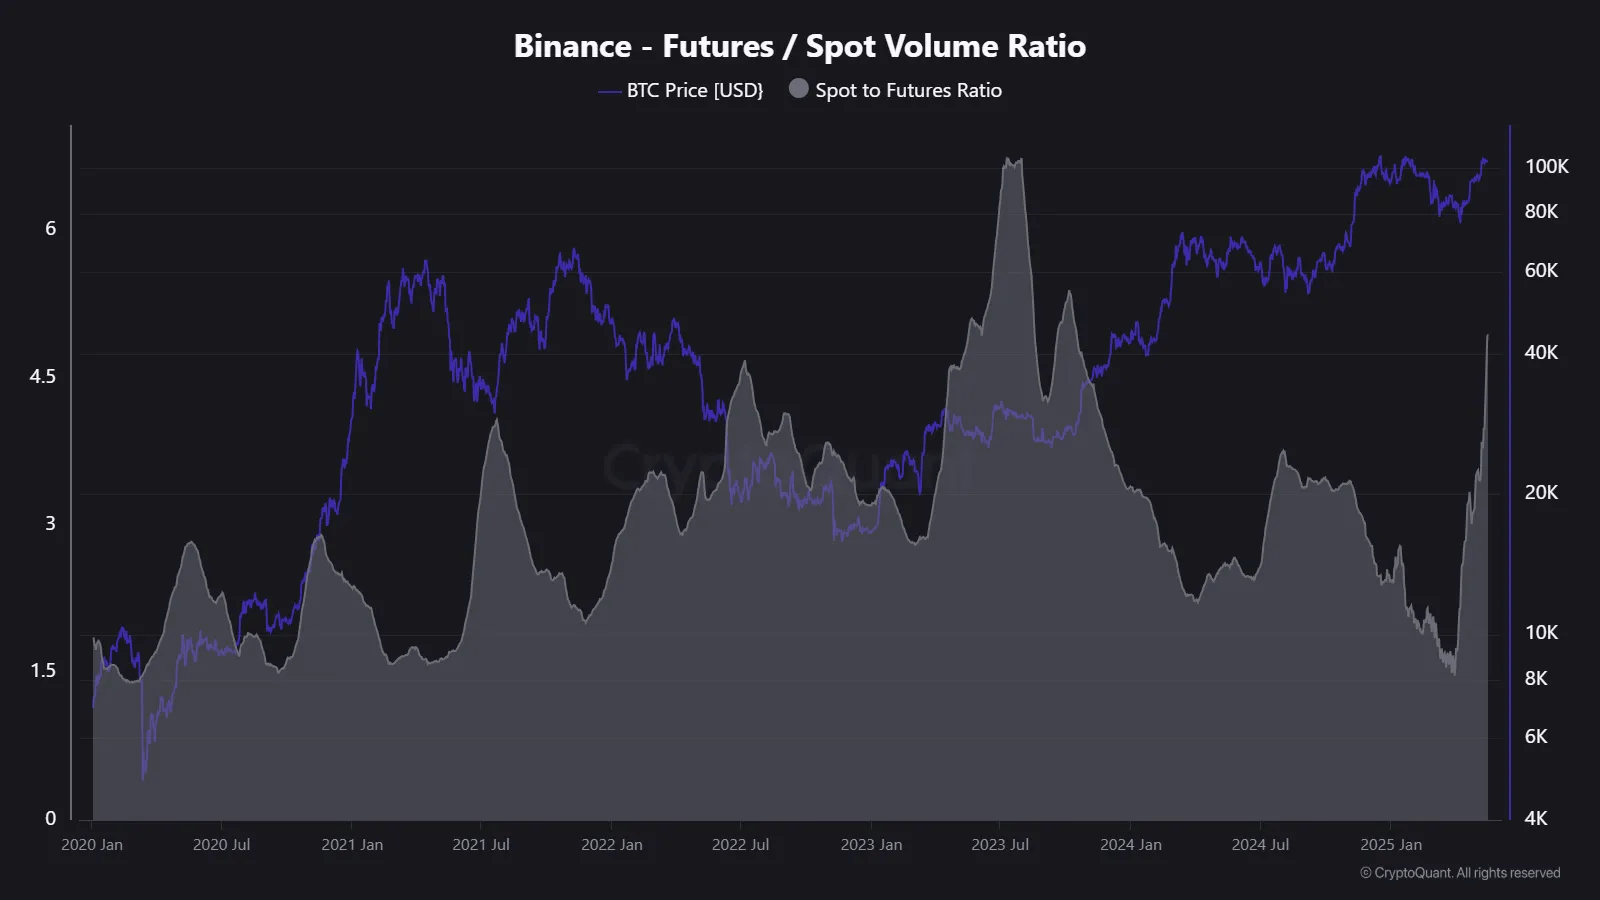
Binance’s Spot-to-Futures Ratio Hits 1.5-Year Peak as Bitcoin Reclaims $109K
Bitcoin continues to show upward momentum as it has now finally reclaimed a critical price mark. As ...