XRP Price Dips Further: Key Support Levels In Jeopardy


XRP price started a downside correction below the $2.20 zone. The price is now declining and might extend losses toward the $2.020 level.
- XRP price started a fresh decline below the $2.20 zone.
- The price is now trading below $2.180 and the 100-hourly Simple Moving Average.
- There is a key bearish trend line forming with resistance near $2.1750 on the hourly chart of the XRP/USD pair (data source from Kraken).
- The pair might start another increase if there is a close above the $2.20 resistance.
XRP Price Dips Further
XRP price failed to continue higher above $2.25 and started a downside correction, like Bitcoin and Ethereum . The price declined below the $2.20 and $2.180 support levels.
The bears even pushed the price below the $2.120 support zone. A low was formed at $2.095 and the price is now consolidating losses. It is trading below the 23.6% Fib retracement level of the downward move from the $2.2579 swing high to the $2.095 low.
The price is now trading below $2.180 and the 100-hourly Simple Moving Average. Besides, there is a key bearish trend line forming with resistance near $2.1750 on the hourly chart of the XRP/USD pair.
On the upside, the price might face resistance near the $2.1320 level. The first major resistance is near the $2.1750 level and the 50% Fib retracement level of the downward move from the $2.2579 swing high to the $2.095 low.
The next resistance is $2.1950. A clear move above the $2.1950 resistance might send the price toward the $2.220 resistance. Any more gains might send the price toward the $2.250 resistance or even $2.30 in the near term. The next major hurdle for the bulls might be $2.320.
More Losses?
If XRP fails to clear the $2.1750 resistance zone, it could start another decline. Initial support on the downside is near the $2.10 level. The next major support is near the $2.080 level.
If there is a downside break and a close below the $2.080 level, the price might continue to decline toward the $2.050 support. The next major support sits near the $2.020 zone.
Technical Indicators
Hourly MACD – The MACD for XRP/USD is now gaining pace in the bearish zone.
Hourly RSI (Relative Strength Index) – The RSI for XRP/USD is now below the 50 level.
Major Support Levels – $2.10 and $2.080.
Major Resistance Levels – $2.1320 and $2.1950.
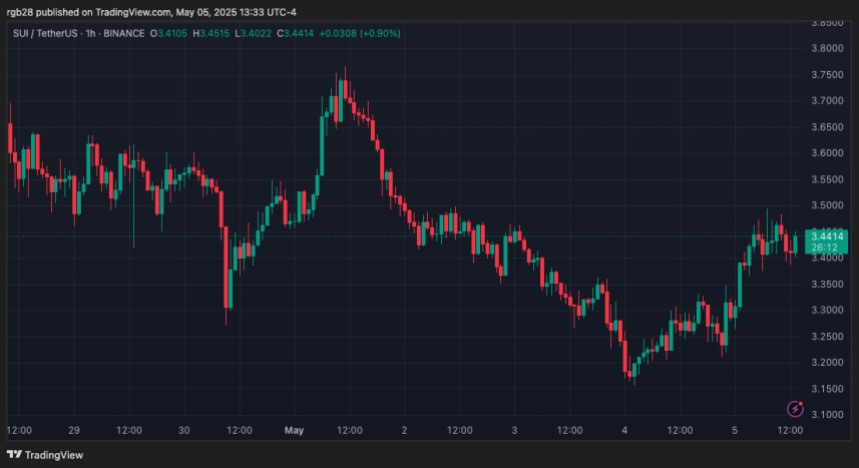
SUI Breakout To $4 Imminent? Analyst Says A Correction To This Level Could Come First
SUI, one of the leading altcoins of this cycle, targets the key $4.00 barrier after its recent price...
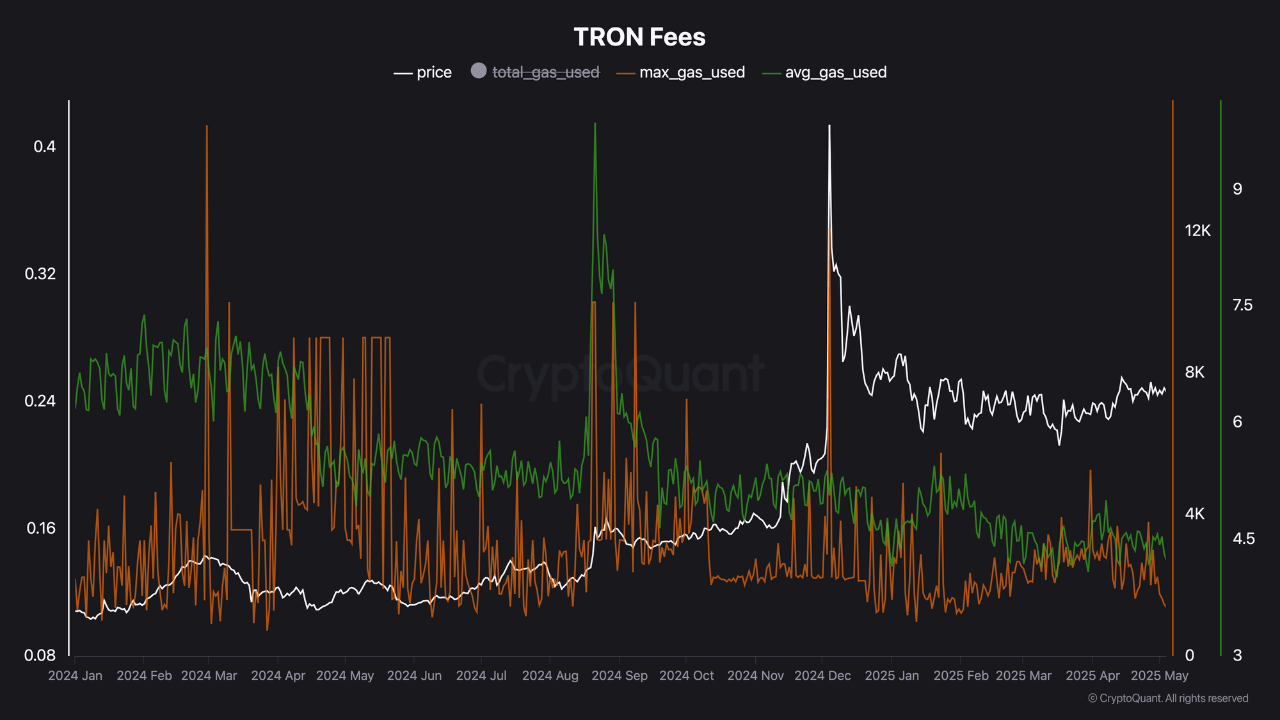
TRON Accumulation Phase Detected—Major Price Surge Coming
Despite ongoing consolidation across the broader crypto market, Tron (TRX) has managed to maintain a...

Strategy Expands Bitcoin Investments With Latest Purchase, Now Holding 555,450 BTC In Total
In a recent filing with the US Securities and Exchange Commission (SEC), Strategy (formerly Microstr...