Dogecoin (DOGE) Turns Red—But Is It a Dip Worth Buying?


Dogecoin started a fresh decline from the $0.1850 zone against the US Dollar. DOGE is now correcting losses and might find face hurdles near $0.1740.
- DOGE price failed to clear $0.1880 and corrected gains.
- The price is trading below the $0.1750 level and the 100-hourly simple moving average.
- There is a key bearish trend line forming with resistance at $0.1725 on the hourly chart of the DOGE/USD pair (data source from Kraken).
- The price could start a fresh increase if it clears the $0.1780 resistance zone.
Dogecoin Price Dips Again
Dogecoin price started a fresh decline after it failed to clear the $0.1880 zone, like Bitcoin and Ethereum . DOGE declined below the $0.1800 and $0.1750 support levels.
Finally, it tested the $0.1680 zone. A low was formed at $0.1685 and the price is now attempting a recovery wave. It climbed above the $0.170 and toward the 23.6% Fib retracement level of the downward move from the $0.1843 swing high to the $0.1685 low.
Dogecoin price is now trading below the $0.1750 level and the 100-hourly simple moving average. Immediate resistance on the upside is near the $0.1720 level. There is also a key bearish trend line forming with resistance at $0.1725 on the hourly chart of the DOGE/USD pair.
The first major resistance for the bulls could be near the $0.1765 level and the 50% Fib retracement level of the downward move from the $0.1843 swing high to the $0.1685 low. The next major resistance is near the $0.1780 level. A close above the $0.1780 resistance might send the price toward the $0.1850 resistance. Any more gains might send the price toward the $0.1880 level. The next major stop for the bulls might be $0.200.
Another Decline In DOGE?
If DOGE’s price fails to climb above the $0.1740 level, it could start another decline. Initial support on the downside is near the $0.1685 level. The next major support is near the $0.1650 level.
The main support sits at $0.1600. If there is a downside break below the $0.160 support, the price could decline further. In the stated case, the price might decline toward the $0.1550 level or even $0.1450 in the near term.
Technical Indicators
Hourly MACD – The MACD for DOGE/USD is now losing momentum in the bearish zone.
Hourly RSI (Relative Strength Index) – The RSI for DOGE/USD is now below the 50 level.
Major Support Levels – $0.1685 and $0.1650.
Major Resistance Levels – $0.1740 and $0.1780.
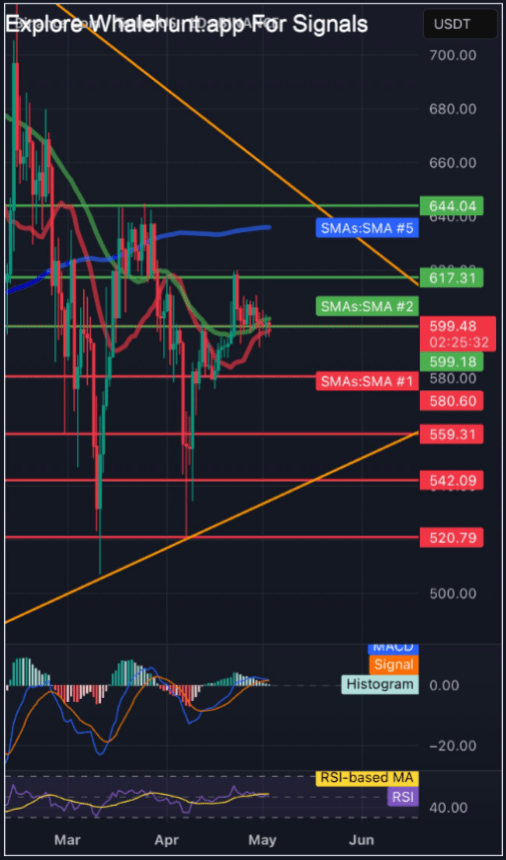
BNB Bulls Target $644 As Classic Chart Formation Emerges
Binance Coin (BNB) is gaining fresh interest as investors closely watch a potential breakout. The to...

Bitcoin Faces Political Headwinds Even as the Best Presales Keep Finding Investors
The close of last week coughed up some rather unpleasant news for Bitcoin (and crypto) supporters. A...

Analyst Says $2 XRP Price Is Low As It Still Isn’t “Activated”
Although the XRP price is hovering above $2, a crypto analyst contends that this level is still low....