XRP Price Momentum Stalls — Bulls on Pause or Done for Now?


XRP price started a downside correction from the $2.25 zone. The price is now consolidating and facing hurdles near the $2.20 level.
- XRP price started a fresh decline from the $2.250 zone.
- The price is now trading below $2.20 and the 100-hourly Simple Moving Average.
- There is a new connecting bearish trend line forming with resistance near $2.1950 on the hourly chart of the XRP/USD pair (data source from Kraken).
- The pair might start another increase if there is a close above the $2.20 resistance.
XRP Price Dips Again
XRP price failed to remain stable above $2.25 and started a downside correction, like Bitcoin and Ethereum . The price declined below the $2.220 and $2.20 support levels.
It even tested the $2.1320 zone. A low was formed at $2.132 and the price is now consolidating losses. It is trading near the 23.6% Fib retracement level of the downward move from the $2.2579 swing high to the $2.1320 low. Besides, there is a new connecting bearish trend line forming with resistance near $2.1950 on the hourly chart of the XRP/USD pair.
The price is now trading below $2.20 and the 100-hourly Simple Moving Average. On the upside, the price might face resistance near the $2.1780 level. The first major resistance is near the $2.20 level and the 50% Fib retracement level of the downward move from the $2.2579 swing high to the $2.1320 low.
The next resistance is $2.220. A clear move above the $2.220 resistance might send the price toward the $2.250 resistance. Any more gains might send the price toward the $2.320 resistance or even $2.350 in the near term. The next major hurdle for the bulls might be $2.50.
More Losses?
If XRP fails to clear the $2.20 resistance zone, it could start another decline. Initial support on the downside is near the $2.1380 level. The next major support is near the $2.1320 level.
If there is a downside break and a close below the $2.1320 level, the price might continue to decline toward the $2.080 support. The next major support sits near the $2.050 zone.
Technical Indicators
Hourly MACD – The MACD for XRP/USD is now gaining pace in the bearish zone.
Hourly RSI (Relative Strength Index) – The RSI for XRP/USD is now below the 50 level.
Major Support Levels – $2.1320 and $2.080.
Major Resistance Levels – $2.20 and $2.250.
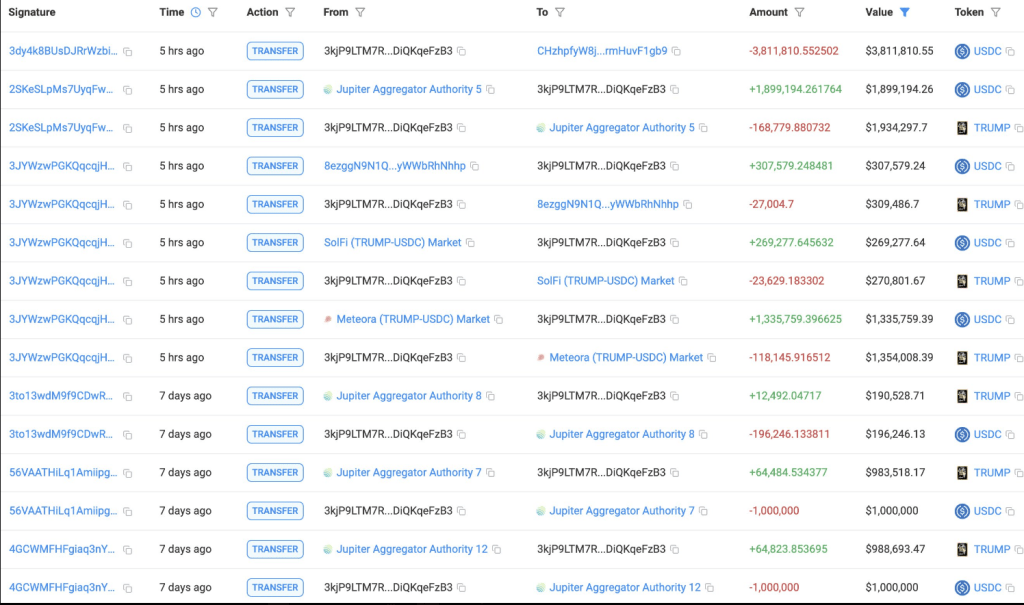
TRUMP Token Bloodbath: Whales Lose Big In $8.58 Million Sell-Off
Two big holders of the TRUMP token sold 765,128 of them for $8.58 million on Saturday morning in a s...
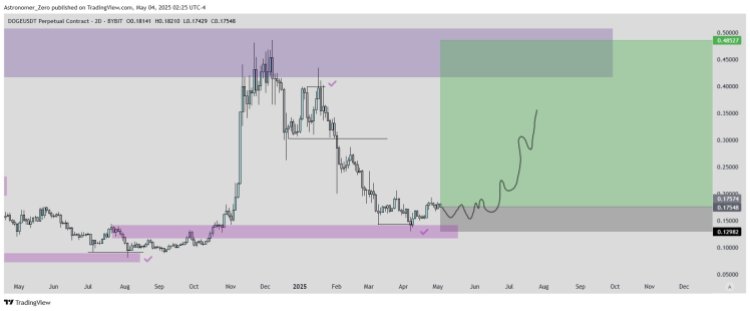
Dogecoin Price Hit An Early Bottom? Why $0.35 Is Still Possible
Dogecoin saw its price crash once again after a month of upward movement in April. This downturn has...
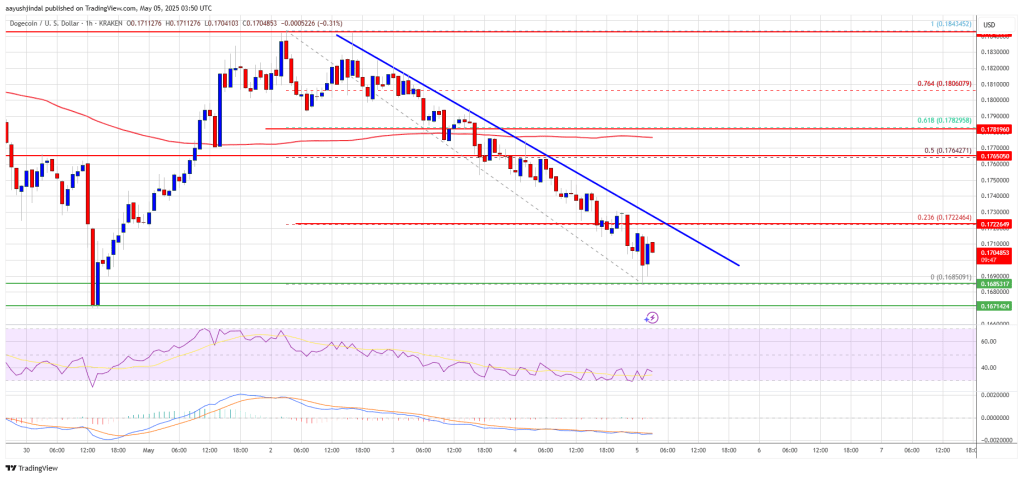
Dogecoin (DOGE) Turns Red—But Is It a Dip Worth Buying?
Dogecoin started a fresh decline from the $0.1850 zone against the US Dollar. DOGE is now correcting...