Bitcoin Price Eases From Highs — Support Zone Still Intact


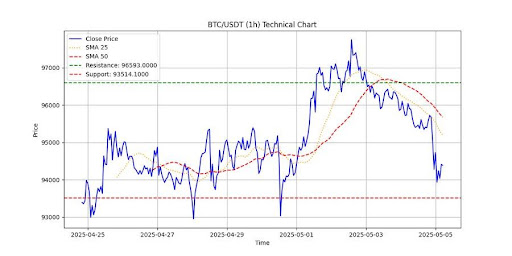
Bitcoin price started a downside correction from the $97,800 zone. BTC is now trading below $95,000 and testing the $93,500 support zone.
- Bitcoin remained supported above the $94,500 zone.
- The price is trading below $96,000 and the 100 hourly Simple moving average.
- There is a connecting bearish trend line forming with resistance at $95,250 on the hourly chart of the BTC/USD pair (data feed from Kraken).
- The pair could start another increase if it clears the $95,750 zone.
Bitcoin Price Dips To Support
Bitcoin price started a downside correction after it failed to clear the $98,000 resistance. BTC declined below the $96,500 and $95,500 support levels.
The bears even pushed it below $95,000. A low was formed at $93,570 and the price is now attempting to recover. There was a move above the $94,000 level and toward the 23.6% Fib retracement level of the recent decline from the $97,885 swing high to the $93,570 low.
Bitcoin price is now trading below $96,000 and the 100 hourly Simple moving average . On the upside, immediate resistance is near the $94,500 level. The first key resistance is near the $95,250 level. There is also a connecting bearish trend line forming with resistance at $95,250 on the hourly chart of the BTC/USD pair.
The next key resistance could be $95,750 and the 50% Fib retracement level of the recent decline from the $97,885 swing high to the $93,570 low. A close above the $95,750 resistance might send the price further higher. In the stated case, the price could rise and test the $96,800 resistance level. Any more gains might send the price toward the $98,000 level.
Another Decline In BTC?
If Bitcoin fails to rise above the $95,250 resistance zone, it could start another downside correction. Immediate support on the downside is near the $94,000 level. The first major support is near the $93,500 level.
The next support is now near the $93,200 zone. Any more losses might send the price toward the $92,500 support in the near term. The main support sits at $91,200.
Technical indicators:
Hourly MACD – The MACD is now losing pace in the bearish zone.
Hourly RSI (Relative Strength Index) – The RSI for BTC/USD is now below the 50 level.
Major Support Levels – $94,000, followed by $93,500.
Major Resistance Levels – $95,250 and $95,750.
Bitcoin Caught In Bearish Drift As It Slips Below Key Support Averages, Bears Taking Over?
According to a recent post on X by Shaco AI, Bitcoin (BTC) is showing a bit of “stage fright” as it ...
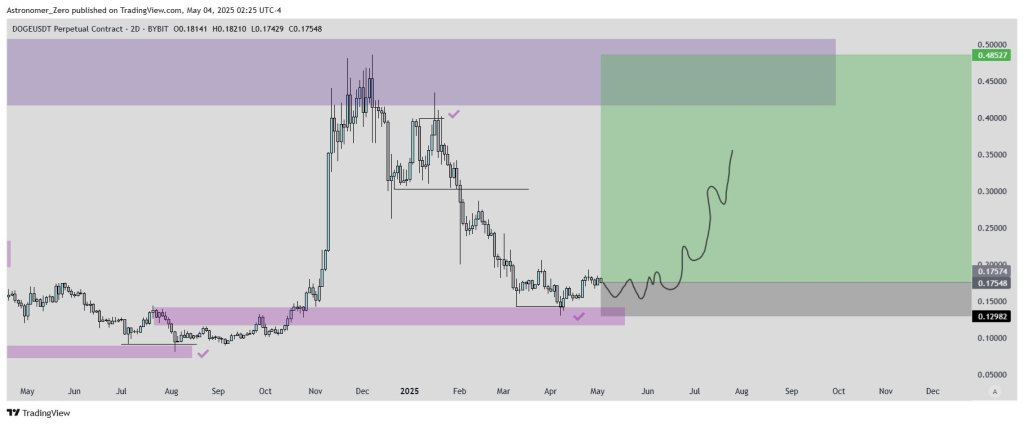
Dogecoin Bounce Expected By Analyst Who Called Bitcoin Bottom
The Dogecoin two-day candlestick chart has returned to the same accumulation shelf that preceded its...
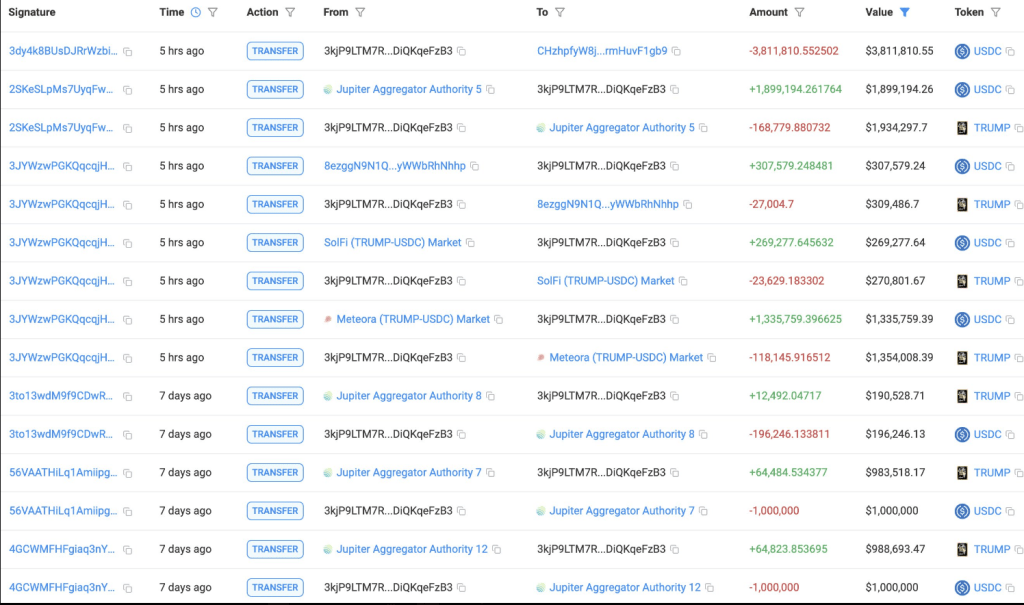
TRUMP Token Bloodbath: Whales Lose Big In $8.58 Million Sell-Off
Two big holders of the TRUMP token sold 765,128 of them for $8.58 million on Saturday morning in a s...