Solana (SOL) Over $150 — More Upside on The Horizon?


Solana started a fresh increase from the $140 support zone. SOL price is now consolidating and might climb further above the $154 resistance zone.
- SOL price started a fresh increase above the $142 and $145 levels against the US Dollar.
- The price is now trading above $150 and the 100-hourly simple moving average.
- There was a break above a key bearish trend line with resistance at $149 on the hourly chart of the SOL/USD pair (data source from Kraken).
- The pair could start a fresh increase if it clears the $154 resistance zone.
Solana Price Consolidates Gains
Solana price formed a base above the $140 support and started a fresh increase, like Bitcoin and Ethereum . SOL gained pace for a move above the $142 and $145 resistance levels.
There was a break above a key bearish trend line with resistance at $149 on the hourly chart of the SOL/USD pair. The pair even spiked above the $150 resistance zone. A high was formed at $153.90 and the price is now consolidating gains.
The price dipped below $152 and tested the 23.6% Fib retracement level of the upward move from the $140 swing low to the $154 high. Solana is now trading above $150 and the 100-hourly simple moving average.
On the upside, the price is facing resistance near the $152 level. The next major resistance is near the $154 level. The main resistance could be $158. A successful close above the $158 resistance zone could set the pace for another steady increase. The next key resistance is $165. Any more gains might send the price toward the $180 level.
Downside Correction in SOL?
If SOL fails to rise above the $154 resistance, it could start another decline. Initial support on the downside is near the $150 zone. The first major support is near the $147 level.
A break below the $147 level might send the price toward the $145 zone and the 50% Fib retracement level of the upward move from the $140 swing low to the $154 high. If there is a close below the $145 support, the price could decline toward the $140 support in the near term.
Technical Indicators
Hourly MACD – The MACD for SOL/USD is gaining pace in the bullish zone.
Hourly Hours RSI (Relative Strength Index) – The RSI for SOL/USD is above the 50 level.
Major Support Levels – $147 and $145.
Major Resistance Levels – $154 and $158.
Crypto Pundit Debunks $100,000 XRP ‘Dark Pool’ Theory
In a video released on Thursday, crypto commentator Zach Rector dismantled a viral claim—popularized...
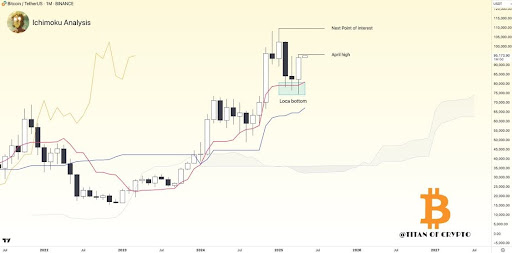
Bitcoin Price Confirmed Local Bottom As All Indicators Flash Bullish, Where’s Price Headed?
The Bitcoin price has just printed a major bullish signal, officially confirming a strong local bott...
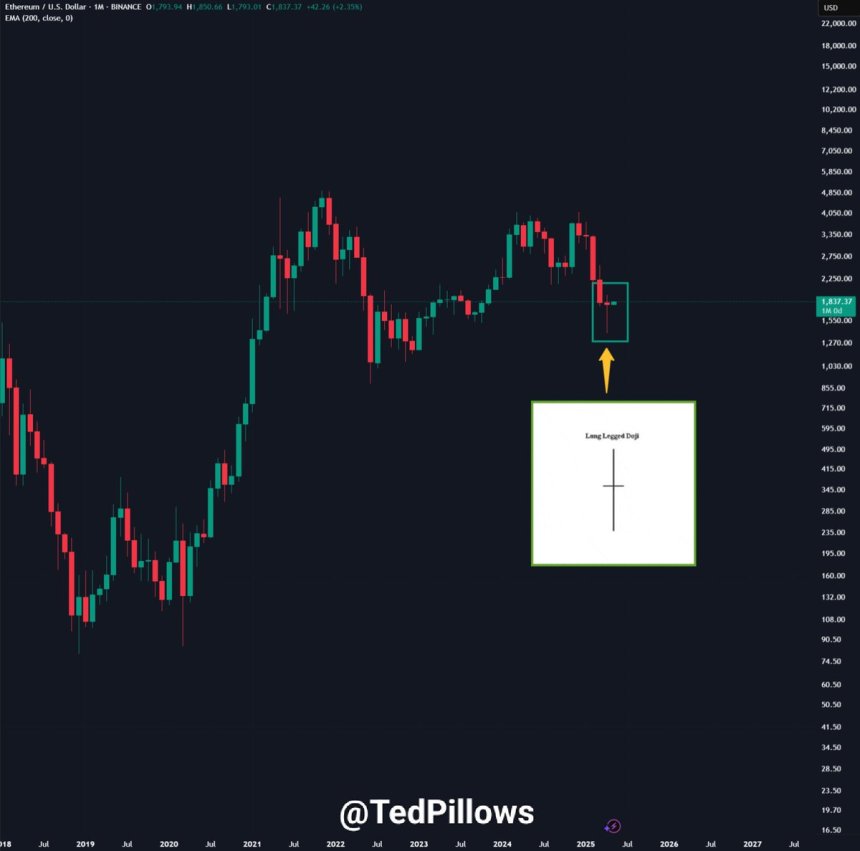
Ethereum Forms Long-Legged Doji On Monthly Chart – Reversal Or Just A Pause?
Ethereum has been holding steady above the $1,800 level despite multiple failed attempts to break hi...