Dogecoin Holds Bullish Structure Amid Volatility, Eyes Key Resistance Levels


- Dogecoin holds a long-term ascending channel since mid-2020 despite short-term volatility.
- Immediate resistance for Dogecoin stands near $0.26, critical for sustaining bullish momentum.
- A drop below $0.12 could invalidate the bullish structure and trigger deeper retracement risks.
Dogecoin (DOGE) maintains its long-standing bullish structure despite experiencing notable short-term volatility. Trading activity around the asset has intensified, with price movements closely aligning with major technical indicators and historic trendlines.
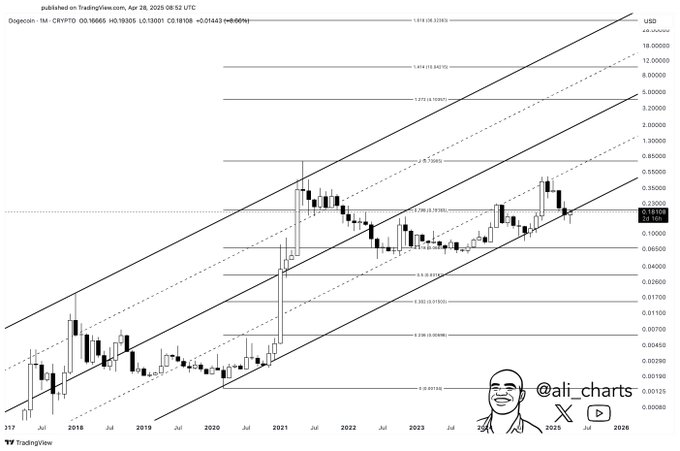
According to a recent chart published on TradingView, Dogecoin has held a long-term ascending parallel channel since mid-2020. The price action shows consistent interactions with both support and resistance trendlines, often correlating with major Fibonacci retracement levels.
After peaking near $0.74 in early 2021, Dogecoin underwent a sharp correction, finding repeated support within the $0.05 to $0.07 range, which coincided with the 0.236 Fibonacci level.
Throughout 2022 and 2023, Dogecoin’s price moved inside the channel, facing resistance near $0.16 and $0.35. In late 2024, a pullback tested but did not break the midline support, adding to bullish strength. As of the latest data, DOGE continues to trade above a key trendline, suggesting that buyers defend crucial zones despite broader market fluctuations.
Short-Term Price Performance and Trading Metrics
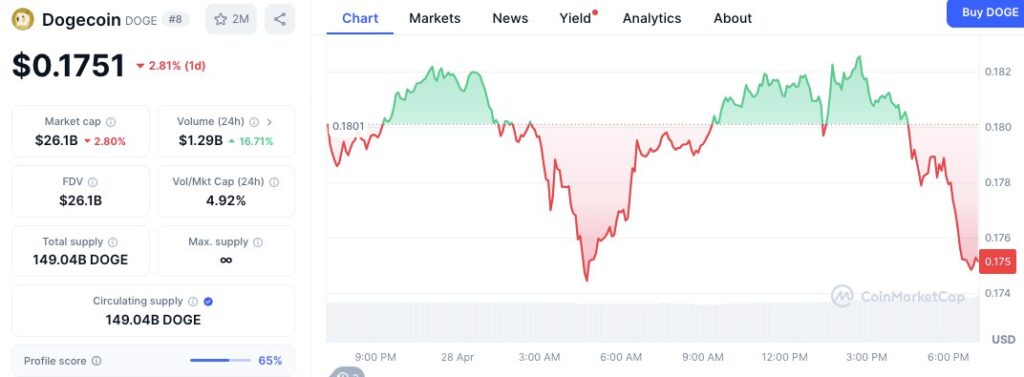
At the time of writing, Dogecoin was trading at $0.1751, which was 2.81% down on the previous 24 hours. Its market capitalization was at $26.1 billion, down by 2.80%. An increase in trading activity was registered – 24h volume went up by 16.71% to $1,290,883,779. The trading activity was relatively moderate, which is further revealed by the Volume-to-Market Cap ratio calculated to be 4.92%.
Sharp fluctuations characterized the movement during the day. The price of DOGE began at $0.1801 and rose to slightly above $0.182 before dropping around 3:00 AM. There was a partial recovery to 6:00 AM, but the asset gave more losses, particularly after 3:00 pm, hence the lower daily close.

Dogecoin’s supply metrics reported approximately 149.04 billion DOGE in total and circulating supply, with no maximum cap specified. According to market cap, it ranks in 8th place, which proves that the community is still engaged and transactions are frequently happening.
Key Levels to Watch: Resistance and Support
Technical analysis from the chart suggests that Dogecoin faces immediate resistance near $0.26, aligned with the 0.618 Fibonacci retracement level from its previous high. A successful breakout above this zone could strengthen bullish momentum, potentially setting the stage for a future rally toward its all-time high near $0.74.

Higher Fibonacci extensions project possible targets beyond the $1.00 mark if upward momentum continues. A breakdown below $0.12, on the other hand, would signal the bears’ heading toward a deeper pullback toward the $0.07 support level.
Volume was not depicted in the chart, but the retention of the ascending channel formation implies that the investors were engaged. Analysts best view the formation as the next tests of the next resistance will determine the strength of this current trend.

1inch Integrates Solana to Unlock $7B Liquidity and Top Swap Rates
By collaborating with Solana, 1inch has now raised its position in the DeFi space and also expanded ...

Dogecoin Bulls Eye $0.30, Pi Coin Unlock Looms, Can Dragoin’s 200B Cap Deliver a 1000x Breakout?
Dogecoin (DOGE) future points to $0.30, Pi network news highlights a 5M token unlock, but Dragoin’s ...

Terminus Taps Gamerge to Boost Web3 Gaming and PayFi Innovation
Terminus and Gamerge partner to deliver a sustainable, enhanced Web3 gaming experience with token re...

