Is This the Final Shakeout Before Bitcoin’s Next Big Move? Analysts Break It Down


Bitcoin’s recent price action has shown signs of stagnation, with the asset hovering around the $84,000 mark after rebounding above it earlier this week. As of the time of writing, BTC is trading at $84,449, down 0.7% in the past 24 hours.
Despite recovering from previous corrections, the price has struggled to break through the current resistance level, signaling weak buying momentum and cautious sentiment among traders.
Bitcoin STH-SOPR and Realized Price Indicate Capitulation
The current phase of consolidation follows weeks of volatile swings driven by broader macroeconomic uncertainty and mixed signals across risk assets.
While long-term holders remain steady, short-term participants in the market appear to be under pressure. Insights into the behavior of these short-term holders may offer valuable clues on the overall direction of the market and possible entry or exit points for investors.
According to a recent analysis shared by CryptoQuant contributor CryptoMe, data from short-term holders (STHs) reveals key indicators that could help define Bitcoin’s current cycle.
The first metric highlighted is the STH Spent Output Profit Ratio (STH-SOPR), which measures whether STHs are selling at a profit (above 1.0) or at a loss (below 1.0).

Currently, this metric is below 1.0 based on a 14-day moving average, indicating that many STHs are offloading BTC at a loss—a signal often associated with capitulation phases.
While this suggests bearish sentiment in the short term, CryptoMe points out that similar dips in STH-SOPR during past bull markets often presented accumulation opportunities.
Historically, these periods of loss-taking by STHs have marked temporary bottoms, with prices rebounding shortly after as stronger hands absorb supply.
Accumulation Opportunities and Strategy Outlook
Another key metric shared is the STH Realized Price, currently around $92,000. This figure represents the average cost basis for coins held by short-term investors.

When Bitcoin trades below this level, it can indicate undervaluation relative to recent buyer activity. In CryptoMe’s view, red zones (in the chart), periods when the spot price dips below the realized price, have often coincided with long-term accumulation zones during previous bullish phases.
However, CryptoMe cautions that these indicators do not confirm a market bottom. Instead, they suggest that some investors are exiting positions under stress, creating potential buying opportunities for those with a long-term outlook.
Given the broader macroeconomic pressures, the analyst maintains a hedged strategy: accumulating in spot markets while maintaining short positions in derivatives to manage downside risk.
He concludes by stating that if macroeconomic conditions improve and liquidity returns to the market, Bitcoin could resume its upward trajectory. Until then, the data suggests patience and risk management may be prudent for market participants awaiting a clearer trend reversal.

Featured image created with DALL-E, Chart from TradingView
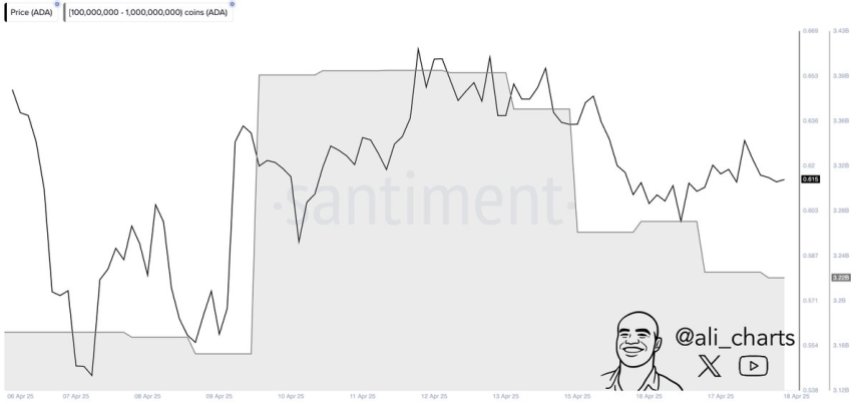
Cardano Whales Offload 180 Million ADA In 5 Days – Smart Profit-Taking?
Cardano is now entering a critical phase after enduring weeks of massive selling pressure and height...

Ripple Takes Asia By Storm With New XRP Product, Here Are The Recent Developments
Ripple is again breaking into the Asia market with a new XRP product, which would help drive institu...

Best Altcoins to Buy as Long-Term $BTC Holders Continue to Remain in Profit Despite Recent Turbulence
Bitcoin has remained sideways for the last couple of months, tossing between the $88K and $75K level...