XRP’s $2.00 Pivot Point—A Launchpad or Breakdown Zone?


XRP price started a fresh decline below the $2.150 zone. The price is now consolidating above $2.00 and facing hurdles near the $2.120 zone.
- XRP price started a downside correction from the $2.250 resistance zone.
- The price is now trading below $2.10 and the 100-hourly Simple Moving Average.
- There is a key bearish trend line forming with resistance at $2.130 on the hourly chart of the XRP/USD pair (data source from Kraken).
- The pair might extend losses if there is a close below the $2.00 support zone.
XRP Price Faces Resistance
XRP price started a downside correction from the $2.250 zone, like Bitcoin and Ethereum . The price traded below the $2.150 and $2.120 levels to enter a bearish zone.
The price even spiked below $2.050 but stayed above $2.00. A low was formed at $2.036 and the price is now consolidating losses. There was a recovery wave above the $2.10 level. The price spiked above the 50% Fib retracement level of the downward move from the $2.184 swing high to the $2.036 low.
The price is now trading below $2.10 and the 100-hourly Simple Moving Average. On the upside, the price might face resistance near the $2.120 level. There is also a key bearish trend line forming with resistance at $2.130 on the hourly chart of the XRP/USD pair.
The trend line is near the 61.8% Fib retracement level of the downward move from the $2.184 swing high to the $2.036 low. The first major resistance is near the $2.180 level. The next resistance is $2.20. A clear move above the $2.20 resistance might send the price toward the $2.250 resistance. Any more gains might send the price toward the $2.320 resistance or even $2.350 in the near term. The next major hurdle for the bulls might be $2.50.
More Losses?
If XRP fails to clear the $2.120 resistance zone, it could start another decline. Initial support on the downside is near the $2.030 level. The next major support is near the $2.00 level.
If there is a downside break and a close below the $2.00 level, the price might continue to decline toward the $1.920 support. The next major support sits near the $1.840 zone.
Technical Indicators
Hourly MACD – The MACD for XRP/USD is now losing pace in the bearish zone.
Hourly RSI (Relative Strength Index) – The RSI for XRP/USD is now below the 50 level.
Major Support Levels – $2.030 and $2.00.
Major Resistance Levels – $2.120 and $2.180.
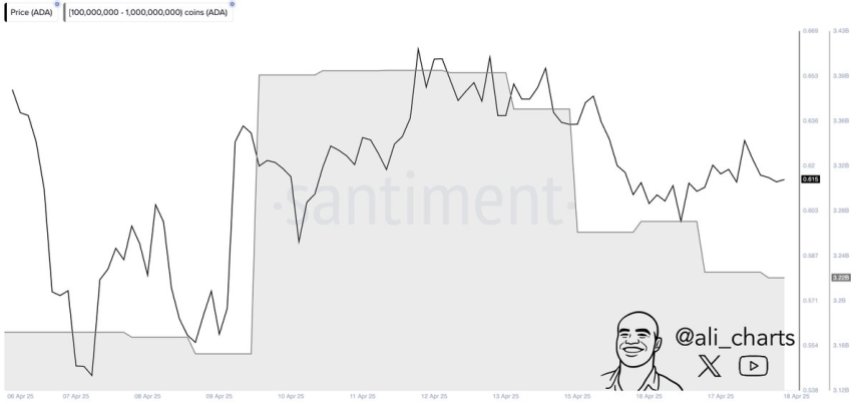
Cardano Whales Offload 180 Million ADA In 5 Days – Smart Profit-Taking?
Cardano is now entering a critical phase after enduring weeks of massive selling pressure and height...

Ripple Takes Asia By Storm With New XRP Product, Here Are The Recent Developments
Ripple is again breaking into the Asia market with a new XRP product, which would help drive institu...

Best Altcoins to Buy as Long-Term $BTC Holders Continue to Remain in Profit Despite Recent Turbulence
Bitcoin has remained sideways for the last couple of months, tossing between the $88K and $75K level...