XRP Price Fate Hangs on $2.00—Major Move Incoming?


XRP price started a fresh decline below the $2.20 zone. The price is now showing a few bearish signs and might decline below the $2.050 level.
- XRP price started a fresh decline after it failed to clear the $2.220 resistance zone.
- The price is now trading below $2.150 and the 100-hourly Simple Moving Average.
- There is a connecting bearish trend line forming with resistance at $2.1480 on the hourly chart of the XRP/USD pair (data source from Kraken).
- The pair might extend losses if it breaks the $2.050 support zone.
XRP Price Dips Further
XRP price failed to continue higher above the $2.220 resistance zone and reacted to the downside, like Bitcoin and Ethereum . The price declined below the $2.20 and $2.120 levels.
The pair even tested the $2.080 zone. A low was formed at $2.081 and the price is now consolidating losses. The current price action is bearish below the 23.6% Fib retracement level of the recent decline from the $2.215 swing high to the $2.081 low.
The price is now trading below $2.150 and the 100-hourly Simple Moving Average. On the upside, the price might face resistance near the $2.150 level. There is also a connecting bearish trend line forming with resistance at $2.148 on the hourly chart of the XRP/USD pair. The trend line is near the 50% Fib retracement level of the recent decline from the $2.215 swing high to the $2.081 low.
The first major resistance is near the $2.180 level. The next resistance is $2.20. A clear move above the $2.20 resistance might send the price toward the $2.250 resistance. Any more gains might send the price toward the $2.280 resistance or even $2.30 in the near term. The next major hurdle for the bulls might be $2.320.
More Losses?
If XRP fails to clear the $2.15 resistance zone, it could start another decline. Initial support on the downside is near the $2.080 level. The next major support is near the $2.050 level.
If there is a downside break and a close below the $2.050 level, the price might continue to decline toward the $2.00 support. The next major support sits near the $1.880 zone.
Technical Indicators
Hourly MACD – The MACD for XRP/USD is now gaining pace in the bearish zone.
Hourly RSI (Relative Strength Index) – The RSI for XRP/USD is now below the 50 level.
Major Support Levels – $2.080 and $2.050.
Major Resistance Levels – $2.150 and $2.20.
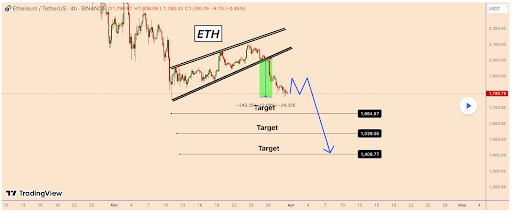
Ethereum Pain Is Far From Over: Why A Massive Drop To $1,400 Could Rock The Underperformer
Crypto analyst Klejdi has indicated that Ethereum’s pain is far from over, with the second-largest c...

XRP’s Rise To Rarity: Only 1% May Afford It, Expert Says
XRP holders may see huge profits if they can hold on through tough economic times, according to one ...
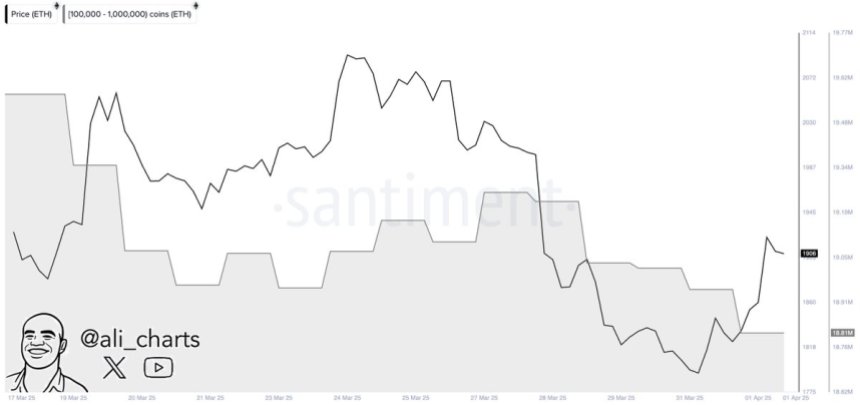
Whales Dump 760,000 Ethereum in Two Weeks — Is More Selling Ahead?
Ethereum continues to face strong headwinds as it trades below the $1,900 mark, with bullish momentu...