Dogecoin (DOGE) Faces Market Correction—Will Buyers Step Back In?


Dogecoin started a fresh decline from the $0.2050 zone against the US Dollar. DOGE is declining and might test the $0.180 support zone.
- DOGE price started a fresh decline below the $0.1980 and $0.1920 levels.
- The price is trading above the $0.180 level and the 100-hourly simple moving average.
- There was a break below a connecting bullish trend line with support at $0.1950 on the hourly chart of the DOGE/USD pair (data source from Kraken).
- The price could gain bullish momentum if it clears the $0.1940 and $0.1980 resistance levels.
Dogecoin Price Dips Again
Dogecoin price started a fresh decline after it failed to clear $0.2050, like Bitcoin and Ethereum . DOGE dipped below the $0.1980 and $0.1920 support levels.
The bears were able to push the price below the 23.6% Fib retracement level of the upward move from the $0.1665 swing low to the $0.2057 high. There was also a break below a connecting bullish trend line with support at $0.1950 on the hourly chart of the DOGE/USD pair.
Dogecoin price is now trading above the $0.180 level and the 100-hourly simple moving average. Immediate resistance on the upside is near the $0.1920 level.
The first major resistance for the bulls could be near the $0.1980 level. The next major resistance is near the $0.2050 level. A close above the $0.2050 resistance might send the price toward the $0.2150 resistance. Any more gains might send the price toward the $0.2220 level. The next major stop for the bulls might be $0.2350.
More Losses In DOGE?
If DOGE’s price fails to climb above the $0.1920 level, it could start another decline. Initial support on the downside is near the $0.1860 level and the 50% Fib retracement level of the upward move from the $0.1665 swing low to the $0.2057 high. The next major support is near the $0.1820 level.
The main support sits at $0.1750. If there is a downside break below the $0.1750 support, the price could decline further. In the stated case, the price might decline toward the $0.170 level or even $0.1650 in the near term.
Technical Indicators
Hourly MACD – The MACD for DOGE/USD is now losing momentum in the bullish zone.
Hourly RSI (Relative Strength Index) – The RSI for DOGE/USD is now below the 50 level.
Major Support Levels – $0.1860 and $0.1820.
Major Resistance Levels – $0.1920 and $0.1980.
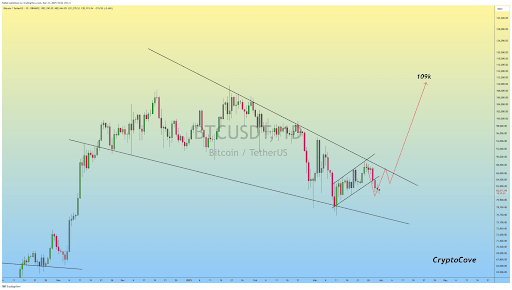
Why Buying Bitcoin Now Is Better Than Later As BTC Price Consolidates Within Falling Wedge
Bitcoin’s price correction over the past week has caused mixed emotions among investors, with some i...

XRP To $27 In 60 Days? Analyst Sees Deja Vu In Price Action
Whispers of a potential big jump for XRP are circulating, with one analyst suggesting it could hit $...
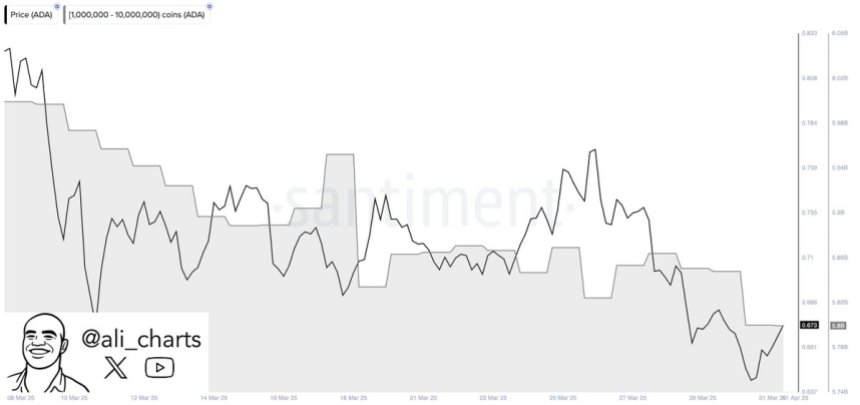
Whales Offload 200M Cardano During March – The Start Of A Trend?
Cardano is currently trading around a key daily demand zone, with bulls attempting to step in and st...