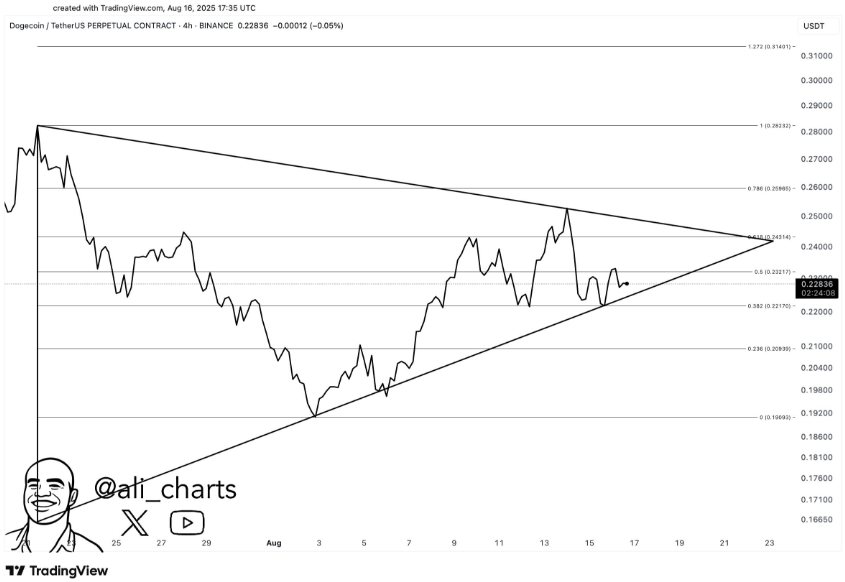
Dogecoin (DOGE) Consolidating in Triangle, 30% Breakout Could Be Next


Dogecoin (DOGE) is quietly tightening its range and several chart-watchers say that could presage a meaningful move, likely to the upside. Crypto analyst Ali Martinez flagged the setup on X (formerly Twitter), tweeting that “Dogecoin $DOGE consolidates in a triangle. A 30% breakout could follow!” The call has reignited debate among traders watching a multi-week pattern that, historically for Dogecoin, has preceded some of its larger swings.
At the time of writing, Dogecoin is trading around $0.234, with Coingecko reporting the 24-hour trading volume around $2.1 billion. The market cap is around $35 billion. That puts DOGE comfortably inside the top 10 by market capitalization among crypto assets.
What Martinez and the Charts See

Martinez’s tweet points to a symmetrical/contracting triangle. Lower highs meeting higher lows, a classic consolidating pattern that squeezes volatility and often produces a decisive breakout when price finally closes outside the converging trendlines. Traders measure the height of the triangle and project that distance from the breakout point to estimate a target, which is how Martinez arrived at his ~30% figure.
Multiple indicators show similar technical readings, with triangle-based upside targets ranging from ~30% to as high as 50–60% depending on the breakout level used. Technically, there are reasons bulls argue the odds are improving. Several analysts and Dogecoin price predictions have noted bullish crossovers and momentum indicators that have flipped more constructive for DOGE in recent weeks.
There is a “golden cross” on certain moving averages, which often signals increasing short-term momentum versus the long-term trend. On-chain and derivatives sentiment has also tilted toward longs at times, which can amplify moves when a breakout occurs.
Double-edged Sword
Patterns like triangles can break either way. Analysts have repeatedly warned that if Dogecoin fails to hold key support levels beneath the triangle, the same structure could project downside targets (potential retracements of 30% or more in adverse scenarios). Volume confirmation is critical: a breakout on light volume is far less reliable than one accompanied by a surge in trading activity and whale movements .
Short-term watchers are keeping an eye on the triangle’s upper trendline (the immediate resistance area) and the ascending support line beneath the price. A daily close above the upper line with expanding volume would be the cleaner bullish signal; conversely, a daily break below the lower trendline would likely hand momentum to sellers and could force a quick retest of lower support bands.
Various analysts’ breakout projections differ. Some peg the first meaningful upside target in the low $0.30s, while more aggressive scenarios aim for the mid-$0.30s and beyond if the move gathers steam. Ali Martinez’s concise tweet captured what many traders see on their screens: Dogecoin is coiled in a textbook consolidation, and a decisive break could produce a fast, sizable move.
That move could be to the upside and potentially in the neighborhood of 30% or more, but the pattern works both ways and depends heavily on confirmation (daily closes and volume). For traders and investors, the sensible course remains the same: watch the trendlines, watch volume, and size positions to account for the possibility of both breakout and breakdown.

Metaplanet Targets to Acquire 1% of Total Bitcoin Supply by 2027
MetaPlanet now expects to grow its Bitcoin holdings to 30,000 $BTC, denoting 60.4% spike towards the...

XRP and Solana Struggle to Match Cold Wallet’s Security and 50× Growth as 2025’s Best Crypto Investment
Explore why Cold Wallet’s biometric access, storage safety, and 50x ROI make it the best crypto inve...

Crypto Market Greed Surges with the Rising Bullish Sentiments
The crypto market sentiment climbs as the Fear and Greed Index reaches 64, indicating rising bullish...

