XRP Flashes Signal That Last Time Preceded A 464% Rally, Analyst Says


In a new video released June 9, crypto analyst CryptoInsightUK issued a extremely bullish XRP update, citing a convergence of technical signals that he believes could set the stage for a powerful upward move. Drawing parallels to previous market cycles, the analyst points to the reappearance of a signal that once preceded a 464% rally in XRP, and says this may mark the beginning of a similar explosive breakout.
XRP Breakout Confirmed?
Yesterday, XRP recorded its highest 4-hour close since May 23, breaking out of a prolonged range. The token has entered what he called a “dense area of liquidity,” an important technical zone that has historically preceded impulsive price action. In a notable divergence from typical market dynamics, XRP is leading Bitcoin, rather than following it. “XRP is currently leading Bitcoin on this move,” he said. “Something I’ve been calling for a while is for XRP to lead alts and lead a potential alt season.”
CryptoInsightUK sees further confirmation in Bitcoin’s setup. BTC is still consolidating but pushing above the $111,000 liquidity zone. A move into that zone, he said, would “give us confluence that the price action XRP’s displaying is not a fakeout.”
Structurally, XRP’s trend remains intact. Despite recent pullbacks, the token has maintained its higher-low formation, a signal of technical strength. More importantly, XRP/BTC is beginning to show momentum reversal. “We’ve just had the highest 4-hour close since the 24th of May. This is showing the momentum to the downside is waning.”
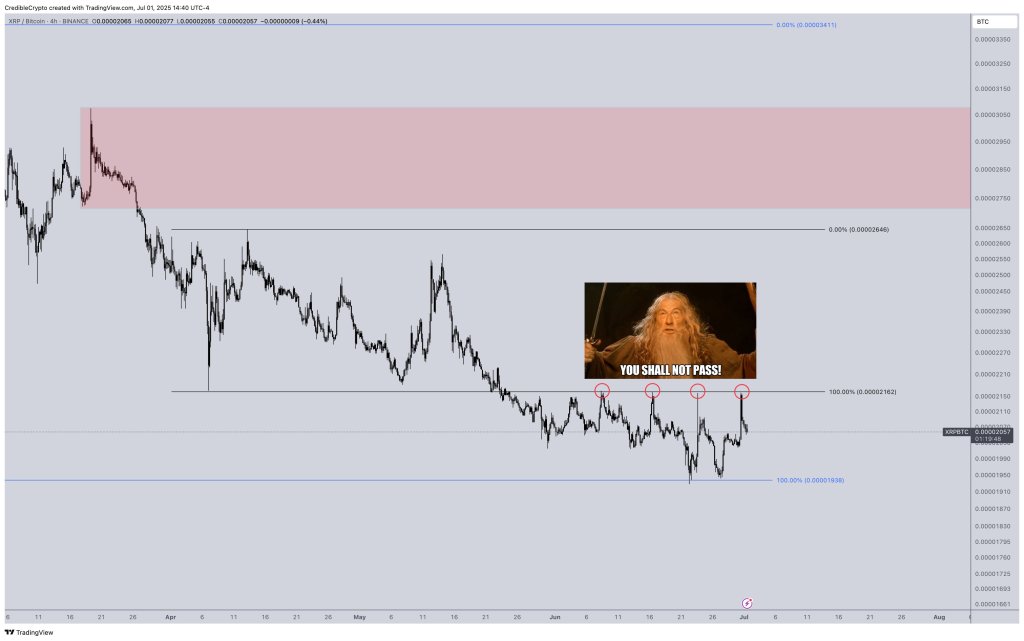
He highlights a specific line on the XRP/BTC chart referenced by fellow analyst Credible Crypto as the “Gandalf line”—a level that has acted as a pivot point for years. XRP has now closed above it on the 4-hour chart. “We’ve wicked into it, bounced off it. We lose it, we get pushed down hard. We break it, we normally really go for it.”
Zooming out, he points to the weekly RSI (Relative Strength Index) on XRP’s price chart. If the current weekly candle closes above the RSI’s simple moving average, it would be the first time since XRP’s breakout off the lows—an event that previously triggered a 464% move to $2.70. “If we get the bullish cross close… 464% from this [level] would take us to $13.05,” he explained. “I think we’re going to about $12 on this push.”
Moreover, the analyst anticipates a 325% move in XRP/BTC based on historical ratios and a potential surge in XRP dominance toward 14%, with an even more aggressive Elliott Wave count pointing to a possible move to 20% dominance . “We’ve completed a Wyckoff accumulation. We’re in the sign of strength phase. Last point support… we’re going into phase E,” he said, referencing classical technical accumulation structures.
Still, despite the bullish setup, the analyst made clear he plans to de-risk between $8 and $13 , emphasizing capital preservation after a potential 20x move from 50 cents. “The risk-to-reward on the downside is just too large at that point,” he noted. “Even if it goes significantly higher… anyone who’s done a 20x on something should be taking some money off the table.”
He concluded the analysis with cautious optimism: “Don’t start counting your Lambos yet, but also probably start scrolling the magazine.” For now, all eyes are on XRP’s price action and Bitcoin’s staying power above $111,000. If both confirm, as he put it: “It’s game on.”
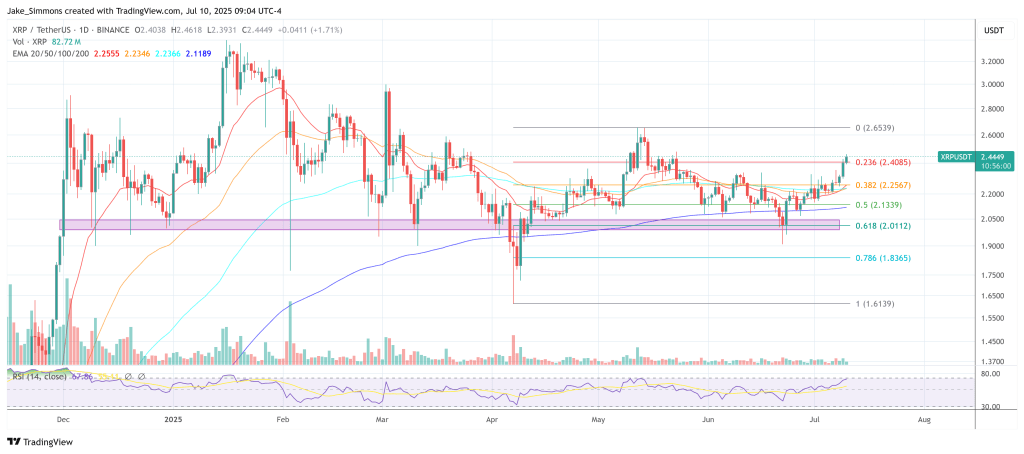
At press time, XRP traded at $2.44.
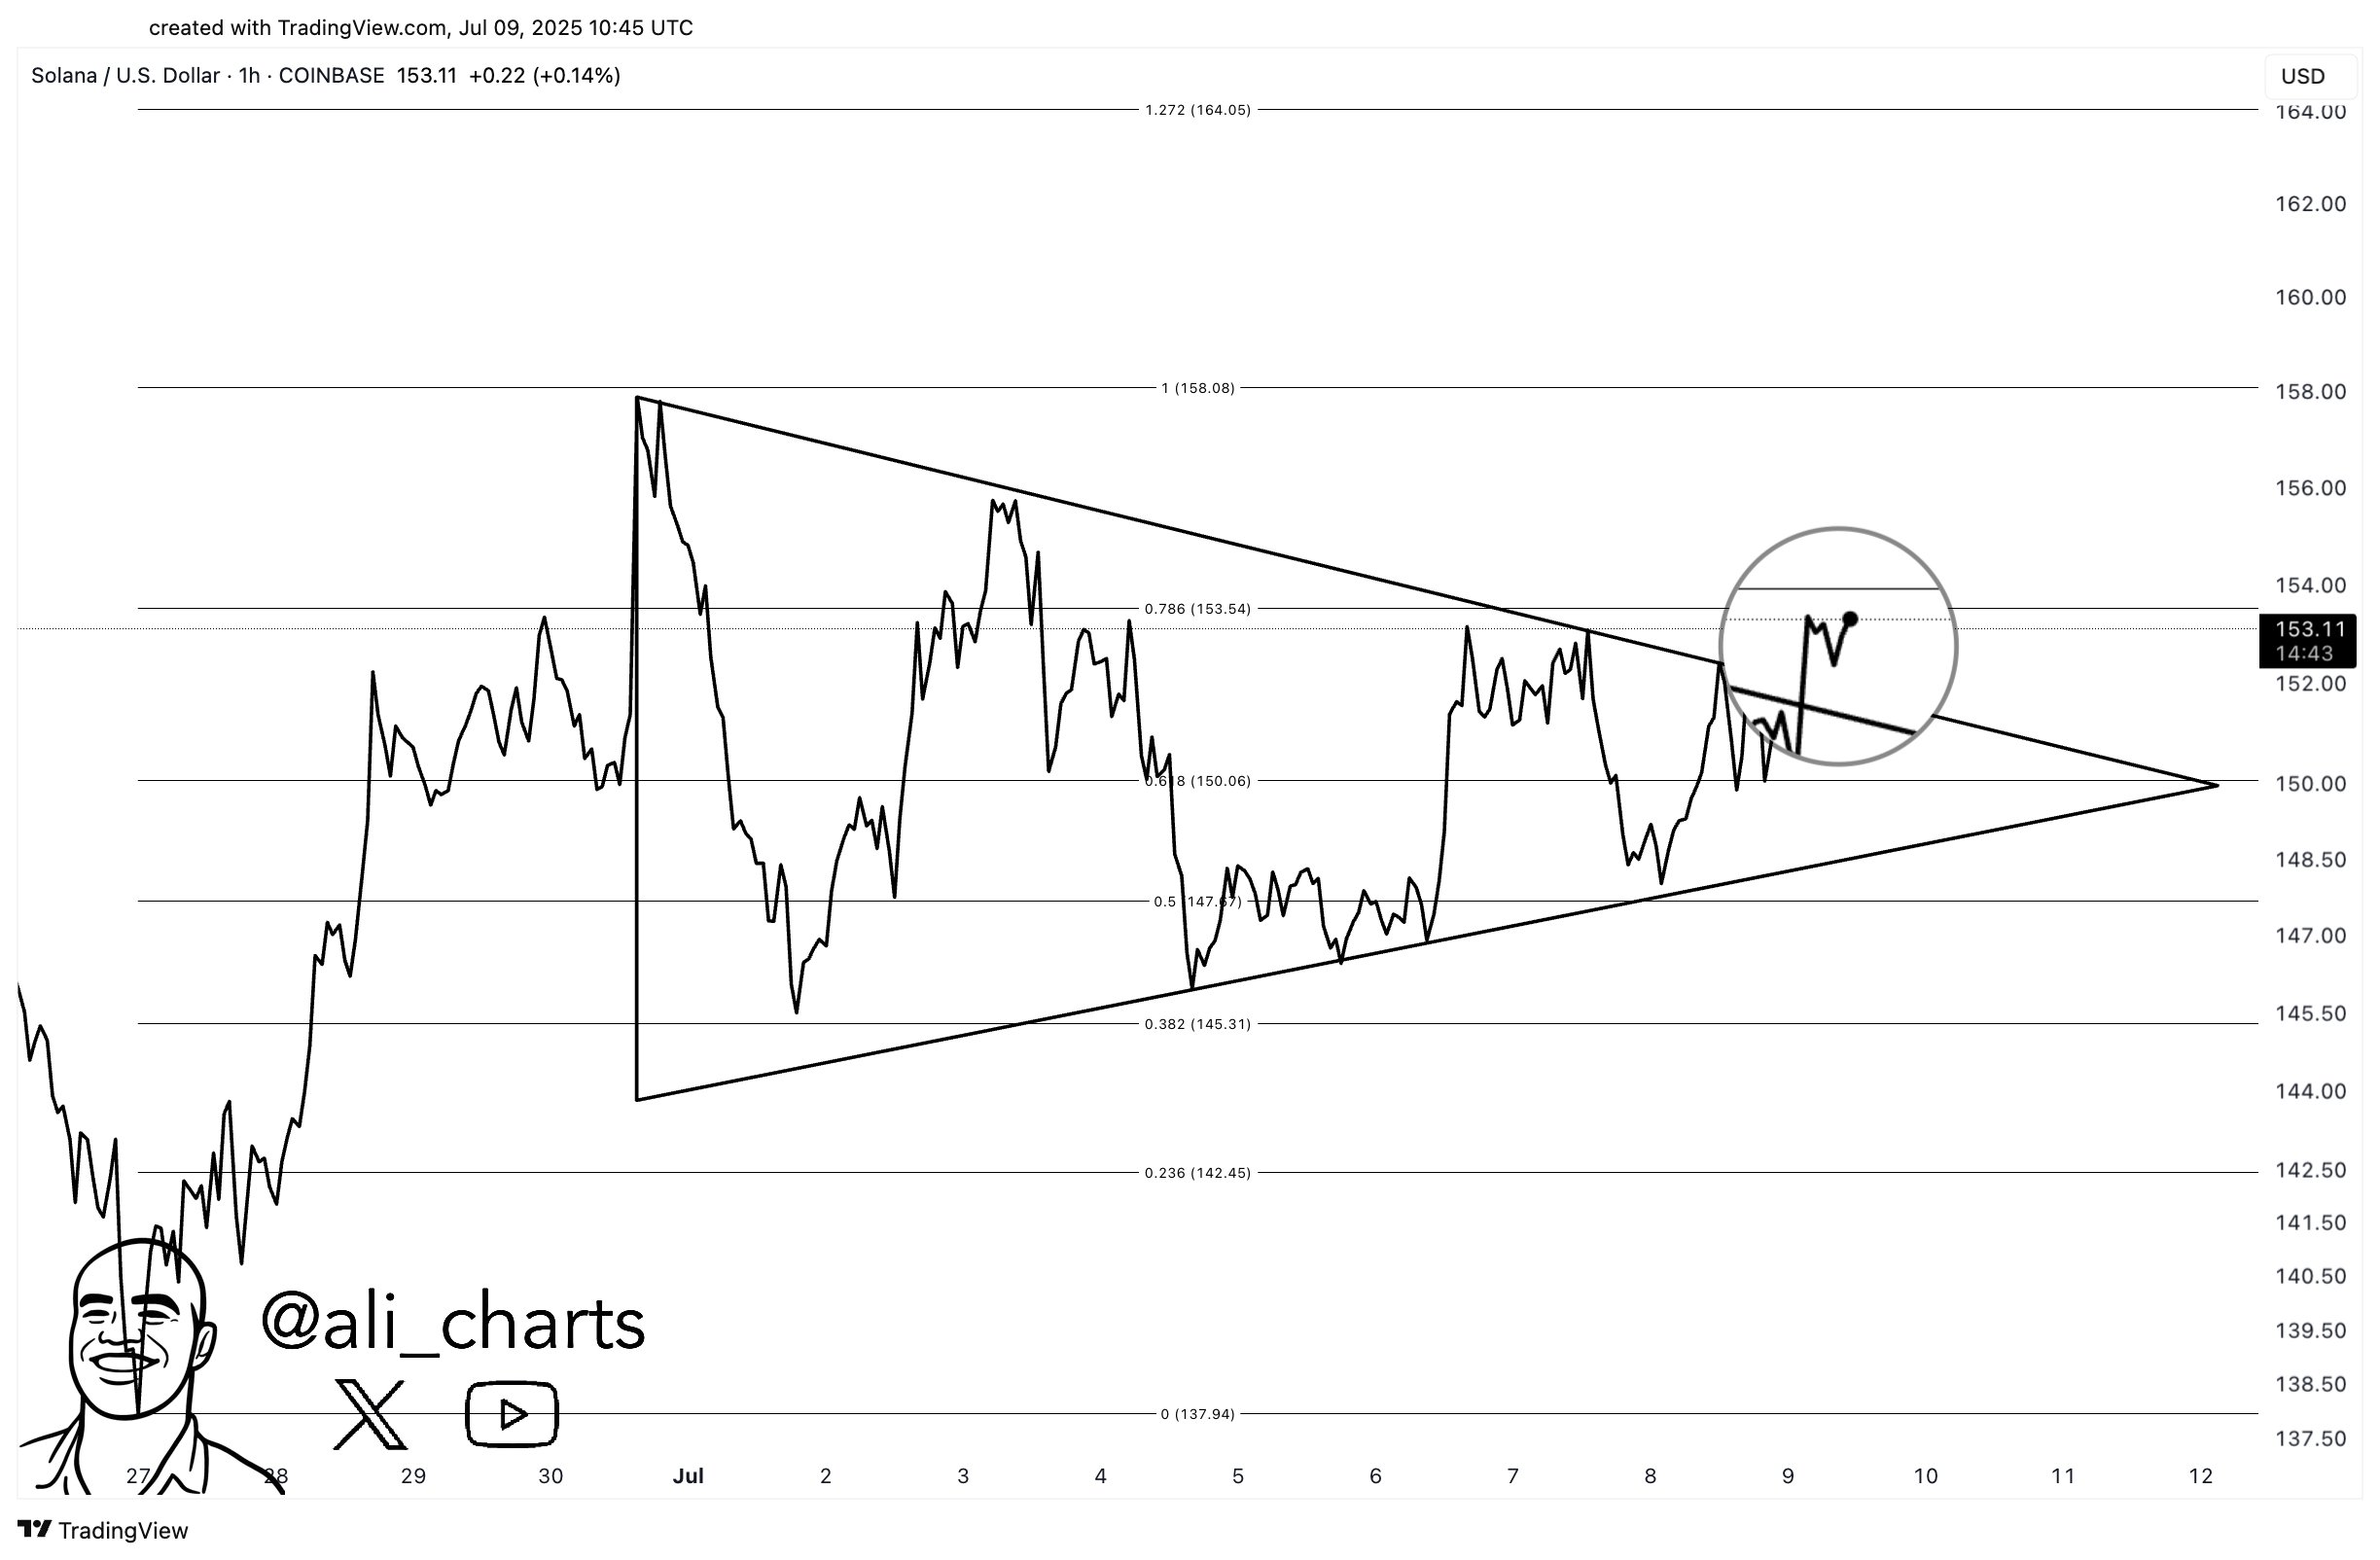
Solana Breaks Out Of Symmetrical Triangle—Next Stop $164?
Solana has shown a potential breakout from a Symmetrical Triangle. Here’s where the next price targe...
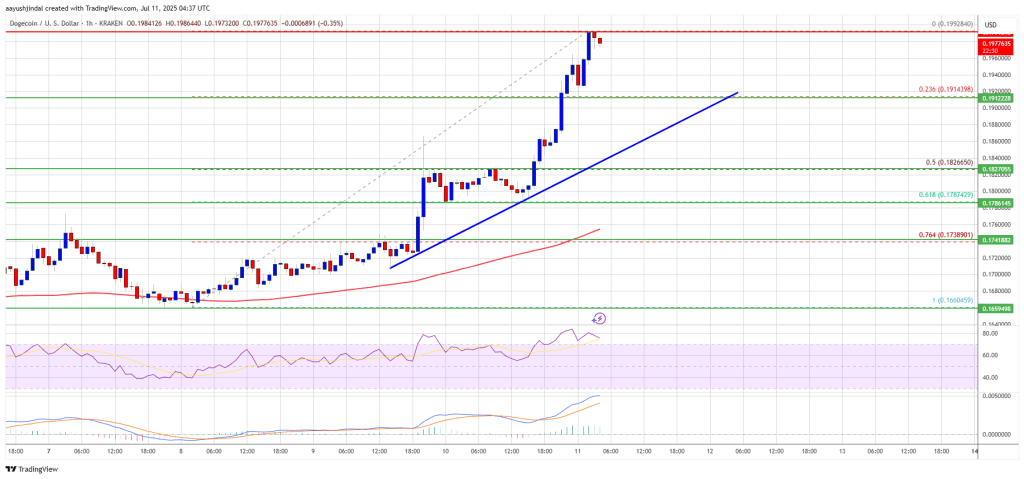
Dogecoin (DOGE) Rockets to $0.20 — Can It Go Even Higher?
Dogecoin started a fresh increase above the $0.180 zone against the US Dollar. DOGE is now consolida...
Drop NFTs Like It’s Hot: Snoop Dogg’s Telegram Collection Raises $12M In 30 Minutes
Hip Hop legend Snoop Dogg released a nearly 1 million non-fungible token (NFT) collection on Telegra...