Dogecoin (DOGE) Rockets to $0.20 — Can It Go Even Higher?


Dogecoin started a fresh increase above the $0.180 zone against the US Dollar. DOGE is now consolidating and might aim for a move above $0.20.
- DOGE price started a fresh increase above the $0.1750 and $0.180 levels.
- The price is trading above the $0.1880 level and the 100-hourly simple moving average.
- There is a bullish trend line forming with support at $0.1910 on the hourly chart of the DOGE/USD pair (data source from Kraken).
- The price could start a fresh rally if it clears the $0.1980 and $0.20 resistance levels.
Dogecoin Price Eyes More Gains
Dogecoin price started a fresh increase from the $0.1750 zone, like Bitcoin and Ethereum . DOGE was able to climb above the $0.180 and $0.1880 resistance levels.
The bulls even pushed the price above the $0.1920 resistance. Finally, the price traded close to the $0.20 barrier. A high was formed at $0.1992 and the price is now consolidating gains above the 23.6% Fib retracement level of the upward move from the $0.1660 swing low to the $0.1992 high.
Dogecoin price is now trading above the $0.1880 level and the 100-hourly simple moving average. Besides, there is a bullish trend line forming with support at $0.1910 on the hourly chart of the DOGE/USD pair.
Immediate resistance on the upside is near the $0.1980 level. The first major resistance for the bulls could be near the $0.20 level. The next major resistance is near the $0.2050 level. A close above the $0.2050 resistance might send the price toward the $0.220 resistance. Any more gains might send the price toward the $0.2320 level. The next major stop for the bulls might be $0.250.
Downside Correction In DOGE?
If DOGE’s price fails to climb above the $0.20 level, it could start a downside correction. Initial support on the downside is near the $0.1910 level or the trend line zone. The next major support is near the $0.1820 level or the 50% Fib retracement level of the upward move from the $0.1660 swing low to the $0.1992 high.
The main support sits at $0.1780. If there is a downside break below the $0.1780 support, the price could decline further. In the stated case, the price might decline toward the $0.1750 level or even $0.1720 in the near term.
Technical Indicators
Hourly MACD – The MACD for DOGE/USD is now gaining momentum in the bullish zone.
Hourly RSI (Relative Strength Index) – The RSI for DOGE/USD is now above the 50 level.
Major Support Levels – $0.1910 and $0.1880.
Major Resistance Levels – $0.1980 and $0.2000.

Don’t Hold Back—Expert Recommends Full Stake In XRP
A top crypto analyst is making waves with a strong call: Going all-in on XRP should be a priority. T...
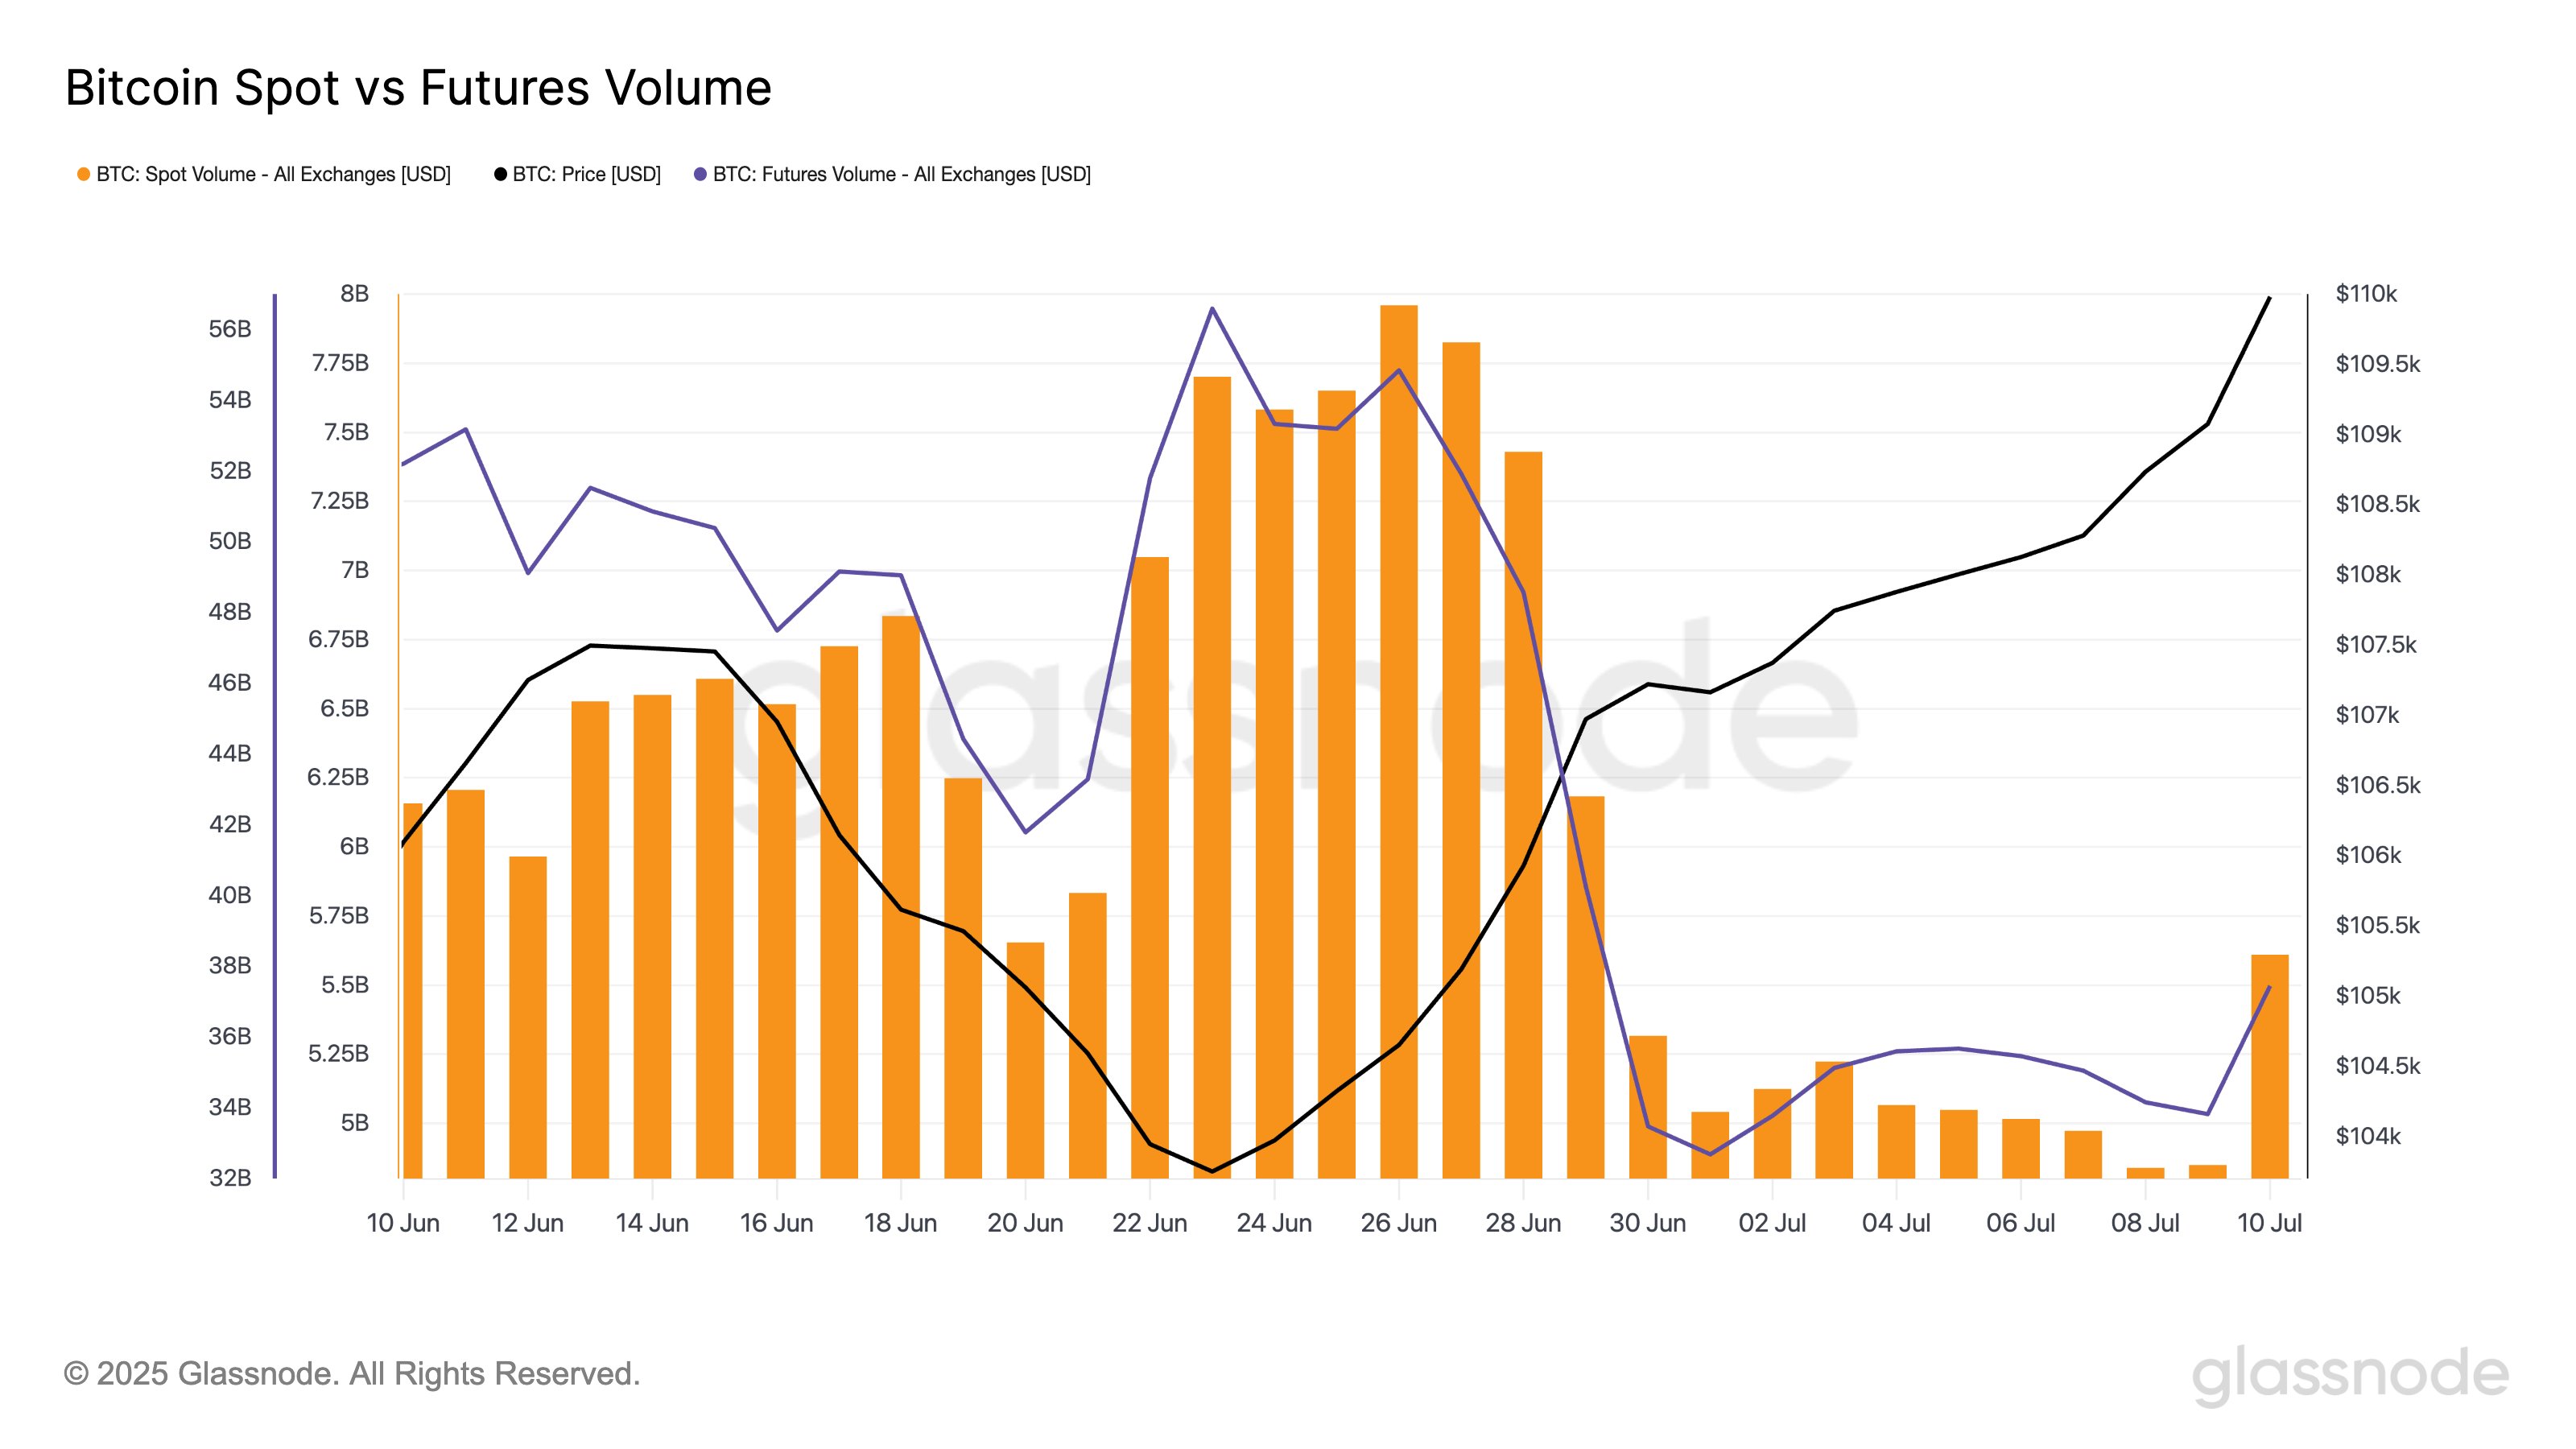
Bitcoin Breaks $118,000—But Liquidity Still Thin, Glassnode Warns
Bitcoin has set a new all-time high (ATH) above $118,000, but on-chain data from Glassnode shows BTC...
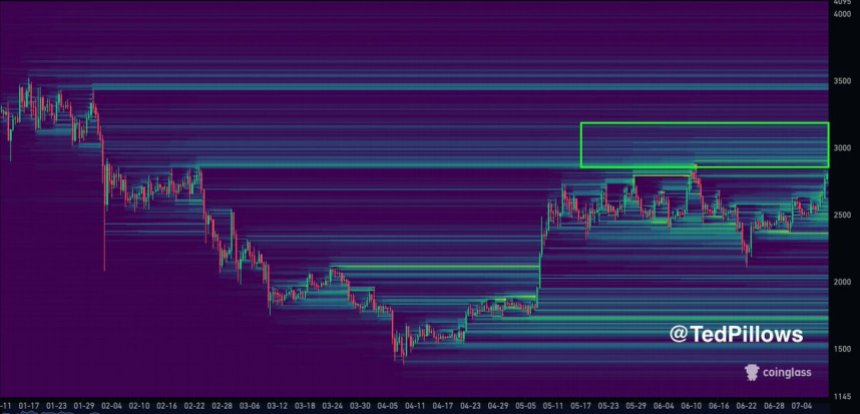
Ethereum Targets Liquidity Above $3,000 – Price Magnet Forming
Ethereum just broke above the critical $3,000 level, marking a major technical milestone after surgi...