Is Solana About To Break Out? Key Levels And Indicators Say Watch Closely


Solana is exhibiting strong bullish signs supported by moving averages, volume, and momentum indicators, which hint at a short-term pause or consolidation in the rally .
What Bulls Need To Watch To Sustain The Rally
In an X post , Gemxbt stated that the Solana 1-hour chart has displayed a bullish market structure, with the price trading above the 5, 10, and 20-day moving averages. The indication of short-term moving averages signals strong upward momentum, which shows that buyers are in control. The recent price action has been supported by notable volume spikes , confirming the strength behind the upward moves and adding credibility to the rally.
The key resistance is around $154, where SOL has previously faced selling pressure. This zone will determine whether bullish momentum can push the price higher. On the downside, support is sitting near $150, which is acting as a cushion to absorb any immediate selling pressure and prevent a deeper pullback.
The Relative Strength Index (RSI) is approaching overbought territory, which may signal that the asset is due for a period of consolidation or sideways movement before continuing its climb. Meanwhile, the Moving Average Convergence Divergence (MACD) has recently shown a bullish crossover, reinforcing the uptrend and suggesting the upward momentum could continue if buying interest persists.

Crypto investor and trader Theodor Coin also revealed that the Solana 1-hour chart is showing a clear recovery after the dip seen in early July. The open interest is trending upward and has now surpassed $3.62 billion.
An increase here typically indicates growing trader market engagement, which is a precursor to heightened volatility and significant price moves. From here, a breakout above the $154 resistance could unleash a powerful rally fueled by the increasing market interest and positive momentum.
Uptrend Line Remains Intact — A Positive Sign
A crypto analyst known as Day on X also updated that Solana is holding above the long-term support area around $120 on the weekly chart, a level that has been a launchpad for rallies.
The long-term uptrend line remains intact, and with each higher low, the case for a massive cup-and-handle pattern becomes stronger. However, this pattern won’t confirm until SOL breaks above the critical $250 resistance zone, a level that capped price action during the previous rally.
If SOL manages to break out above the $250 zone, it could unlock a measured move price target of $500, which marks a milestone in Solana’s recovery and expansion. The analyst also noted that SOL is not there yet, and that the first step for bulls is reclaiming $185 resistance level, which has consistently rejected upside attempts.

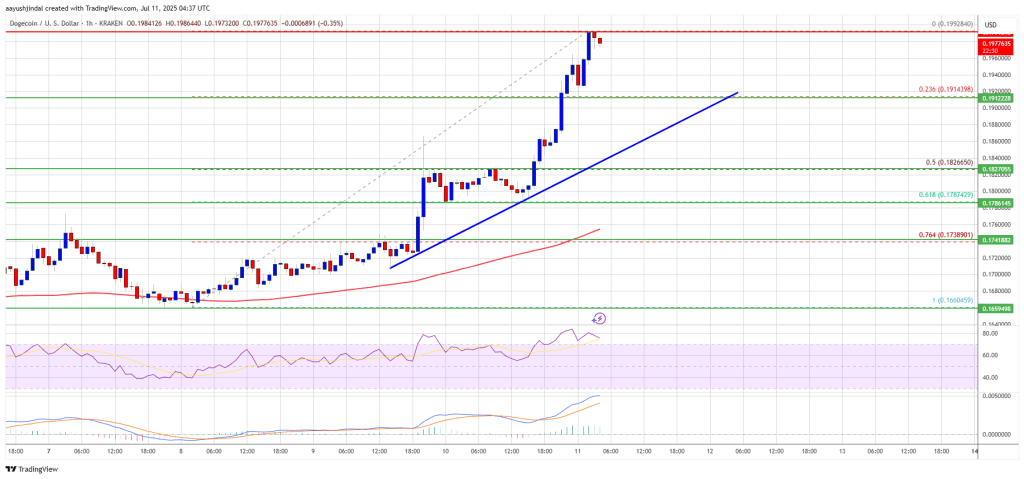
Dogecoin (DOGE) Rockets to $0.20 — Can It Go Even Higher?
Dogecoin started a fresh increase above the $0.180 zone against the US Dollar. DOGE is now consolida...
Drop NFTs Like It’s Hot: Snoop Dogg’s Telegram Collection Raises $12M In 30 Minutes
Hip Hop legend Snoop Dogg released a nearly 1 million non-fungible token (NFT) collection on Telegra...
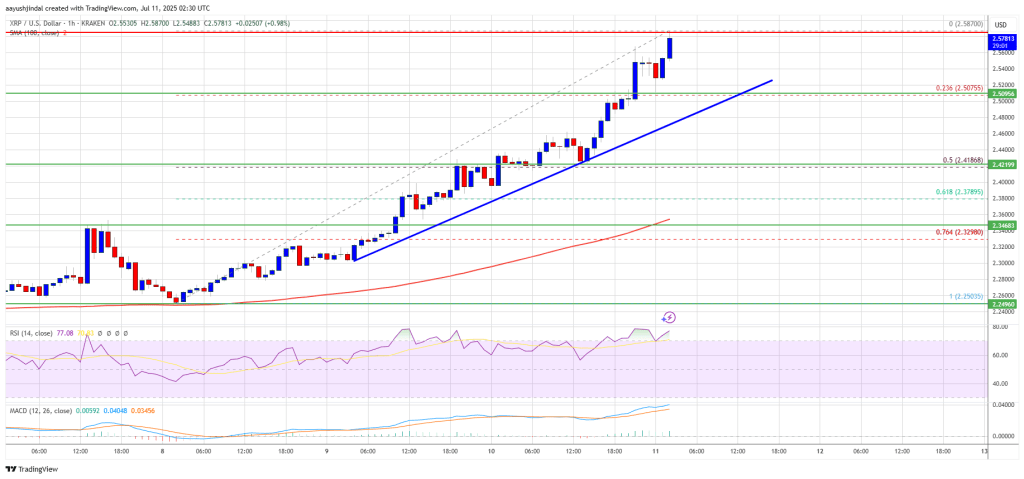
XRP Price Builds Momentum — $2.50 Break Sparks Fresh Bullish Wave
XRP price started a fresh increase above the $2.50 zone. The price is now showing positive signs and...