Bitcoin Is One Candle Away From $141,300 Breakout, Chart Master Warns


Top analyst Aksel Kibar (CMT) believes Bitcoin is approaching a decisive moment on the weekly chart. In a post shared on 9 July 2025, the veteran technician noted that BTC/USD is “holding right at the pattern boundary.” The annotated chart he released—covering Bitstamp weekly prices back to mid-2022—shows the cryptocurrency compressing directly beneath a horizontal resistance band at $109,000, the neckline of what he labels a six-month head-and-shoulders (H&S) continuation formation.
Bitcoin Poised For $141,300
Kibar’s chart first revisits the basing sequence that reversed the 2022 bear cycle. A textbook inverse head-and-shoulders bottom completed in early-2023, with troughs at roughly $17,600 (left shoulder), $15,500 (head) and $19,500 (right shoulder). The breakout above the neckline sent Bitcoin to $31,400.
Immediately thereafter, price stalled in a six-month rectangle bounded by $25,000 support and $31,400 resistance. The eventual topside resolution propelled the market to the rectangle’s implied target of $38,000, validating two consecutive classical projections in less than a year. Afterwards, the BTC price grinded higher. Below $73,700, BTC consolidated in a falling wedge, ending with a breakout toward $109,000.
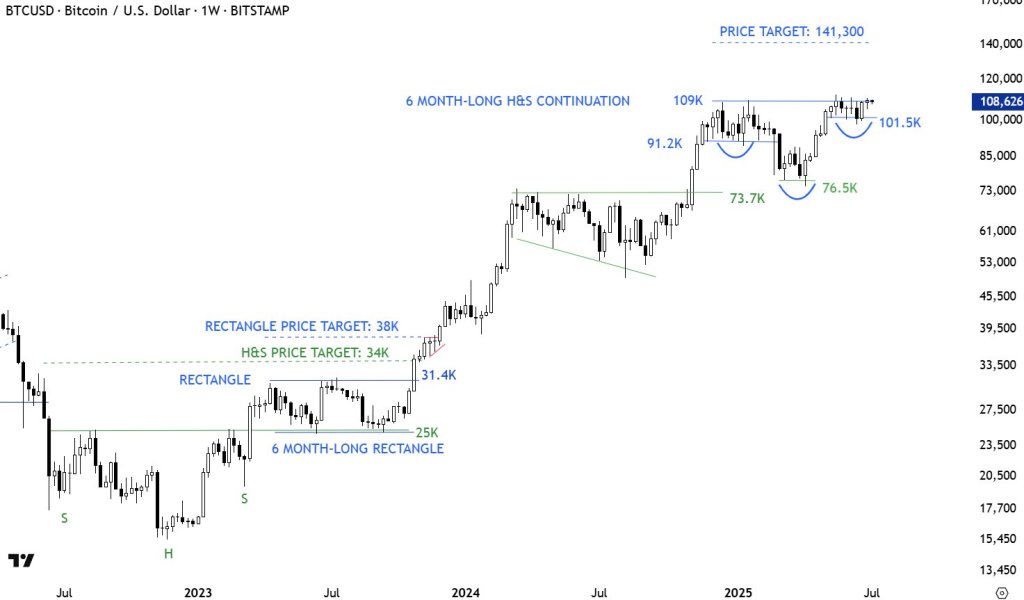
From that point, the initial pullback bottomed at $91,200, creating what Kibar designates as the left shoulder. A deeper descent to $76,500 carved out the head. Then, the Bitcoin price formed the right shoulder at $101,500, echoed by the blue bowl-shaped arc on the chart.
Throughout this structure the neckline at $109,000 remained intact, acting as a clear demarcation between consolidation and fresh highs. The inverse head-and-shoulders pattern spans roughly half a year, matching the analyst’s “6-month-long” annotation.
Using the orthodox H&S continuation rule—adding the vertical distance from the head ($73,700) to the neckline ($109,000) to the breakout level—Kibar derives a price objective of $141,300. He notes in an X reply that this target is separate from the earlier $137,000 objective, which came from a larger cup-with-handle on the monthly scale. In other words, the shorter-term weekly pattern now projects modestly higher than the longer-term structure.
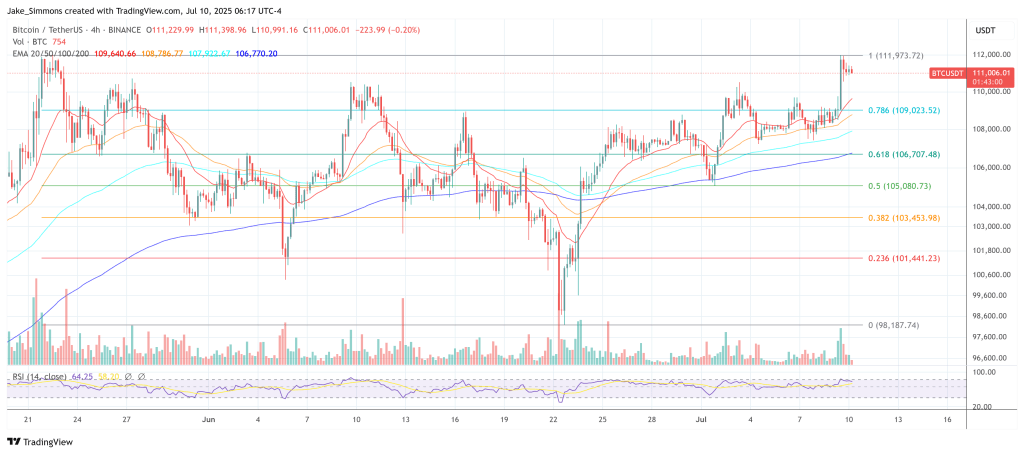
At press time Bitcoin, Bitcoin traded near $111,000, surpassing the neckline. However, from a technician’s standpoint, the breakout still needs to confirm with the weekly close. Confirmation requires a decisive weekly settlement north of the $109,000 neckline. As Kibar notes: “Breakout needs to take place with a long white candle, similar to previous pattern completions. There should be no hesitation.”
Invalidation would emerge on a weekly close back below the most recent swing-low support at $101,500; deeper failure beneath $91,2000 would unravel the pattern entirely.
For now, Bitcoin sits at the fulcrum of its six-month equilibrium. A weekly candle or two should reveal whether the largest digital asset can convert yet another classical chart formation into a measured move—this time toward mid-six-figure territory.
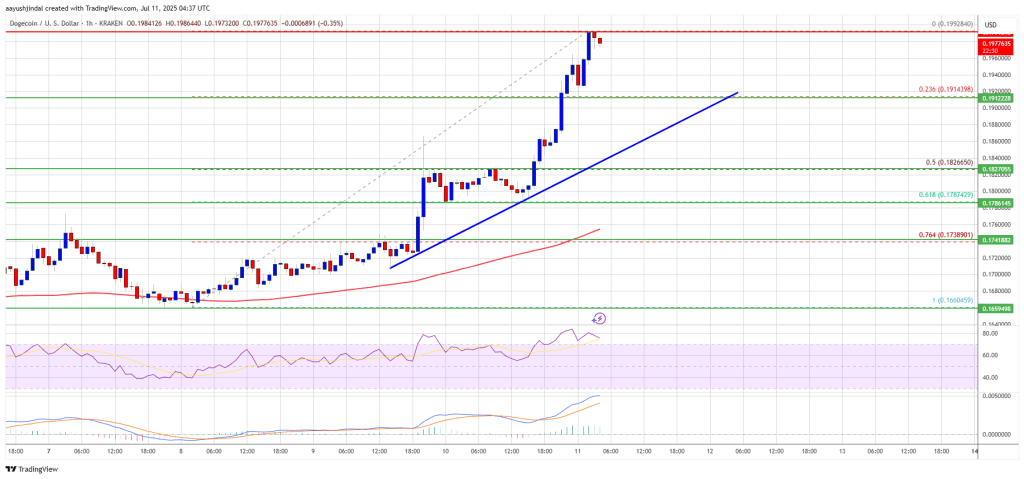
Dogecoin (DOGE) Rockets to $0.20 — Can It Go Even Higher?
Dogecoin started a fresh increase above the $0.180 zone against the US Dollar. DOGE is now consolida...
Drop NFTs Like It’s Hot: Snoop Dogg’s Telegram Collection Raises $12M In 30 Minutes
Hip Hop legend Snoop Dogg released a nearly 1 million non-fungible token (NFT) collection on Telegra...
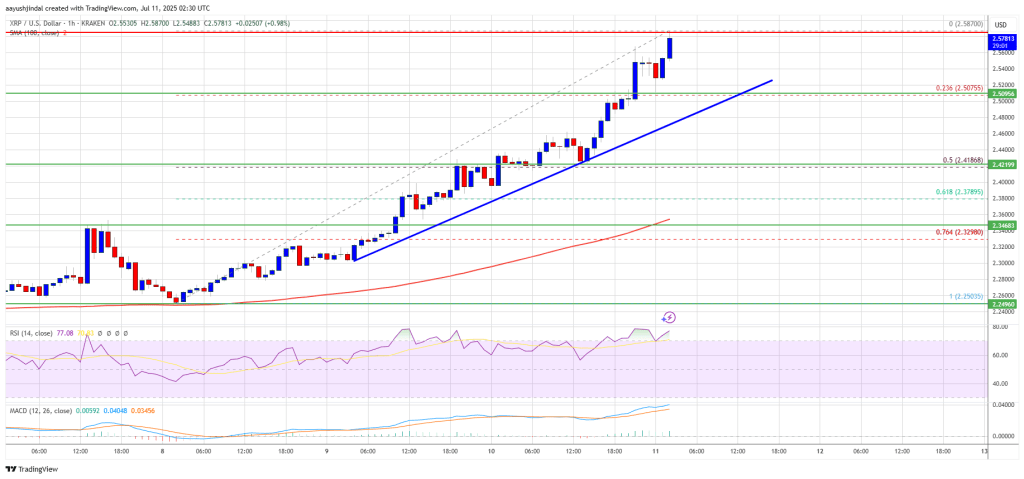
XRP Price Builds Momentum — $2.50 Break Sparks Fresh Bullish Wave
XRP price started a fresh increase above the $2.50 zone. The price is now showing positive signs and...