Is Bitcoin Ready to Pop? Analyst Warns of Sell-Side Liquidity Squeeze as Whales Take Over


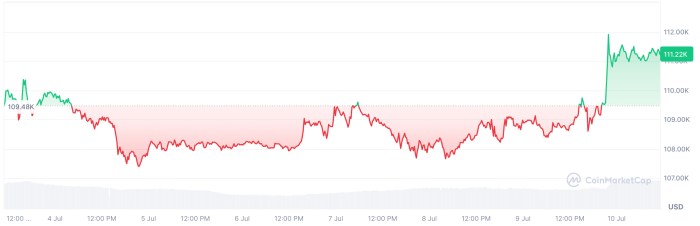
Bitcoin continues to hover just below its previous all-time high, consolidating around the $109,000 mark despite a modest 1.9% gain over the past day. The asset reached a 7-day high of $110,307 but has yet to reclaim the historic high of $111,814, a level set back in May.
While short-term price action remains within a tight range, on-chain data reveals deeper structural developments that could shape Bitcoin’s trajectory in the weeks ahead.
As attention focuses on Bitcoin’s potential for a breakout, some analysts are turning to supply dynamics for clues. One notable observation comes from CryptoQuant contributor Chairman Lee, who has identified a significant reduction in BTC held on centralized exchanges.
This trend may serve as a key indicator of future price behavior , especially in the context of institutional demand and exchange activity.
Bitcoin Exchange Reserves Drop to Multi-Year Lows
Chairman Lee’s analysis highlights a continued decline in exchange-held Bitcoin, with reserves falling to a multi-year low of 2.4 million BTC. This figure is down from over 3.1 million BTC reported in mid-2023.
The consistent drawdown in exchange balances is interpreted as a signal that selling pressure is decreasing, which historically has preceded price expansions .
According to Lee, “This persistent decline in reserve levels suggests that sell-side liquidity is drying up… Historically, such conditions—where BTC held on exchanges is low—precede major bullish expansions as demand exceeds supply.”
In past market cycles, including the 2020–2021 bull run, similar drops in exchange reserves were followed by sharp upward movements in Bitcoin’s price.
The logic is based on basic supply-demand mechanics: when available BTC becomes scarce on exchanges, any increase in demand, particularly from ETFs or institutional buyers , can lead to accelerated price growth.
Lee emphasizes that this current trend could act as a foundational tailwind, potentially supporting further gains if current demand patterns remain in place.
Binance Dominates Whale Transaction Flows
Another piece of the market structure puzzle comes from CryptoQuant analyst Crazzyblockk, who examined large-scale BTC transactions across major centralized exchanges. According to his report, Binance has maintained its position as the dominant venue for Bitcoin whale activity.

Whale flows are defined in this context as daily inflows or outflows exceeding 1,000 BTC. Binance has recorded cumulative whale inflows of 31.36 million BTC and outflows of 30.82 million BTC, along with 53.2 million whale transactions, significantly more than any other exchange.
Notably, these numbers do not reflect unique BTC, but rather total flow volumes that include repeated movements of the same coins. High transaction volumes suggest Binance is favored for its liquidity and infrastructure, allowing whales to engage in trading, custody shifts, and arbitrage with minimal friction.
The data also places HTX Global and Kraken in the second and third positions, respectively, for whale inflows, though their volumes are substantially lower than Binance’s.

Featured image created with DALL-E, Chart from TradingView
Bitcoin Blasts to $112,017 ATH – What’s the Best Crypto to Buy Before the Next Surge?
After hovering below the $110K mark over the past few weeks, Bitcoin hit a new all-time high yesterd...
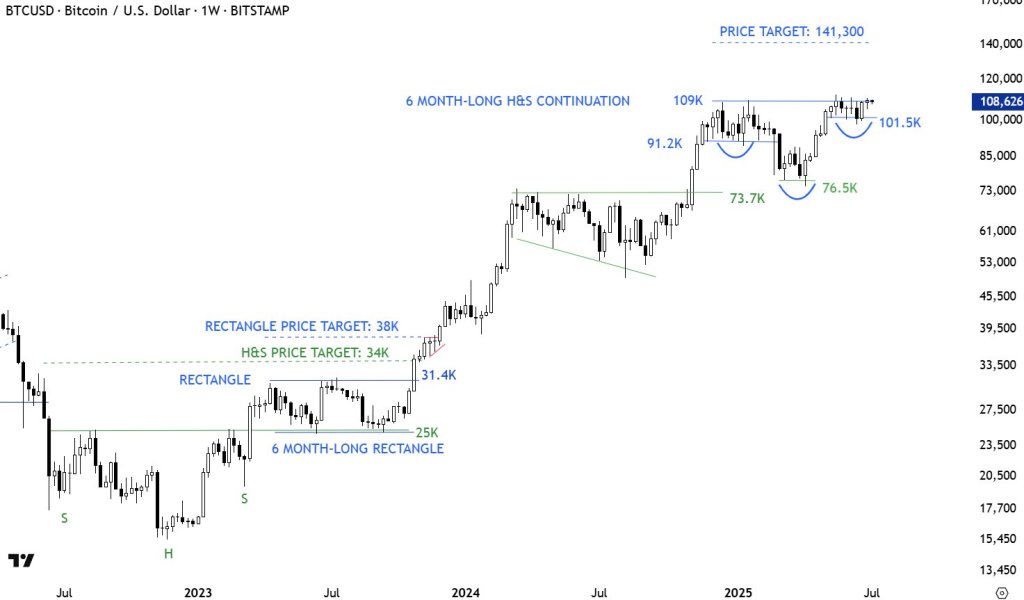
Bitcoin Is One Candle Away From $141,300 Breakout, Chart Master Warns
Top analyst Aksel Kibar (CMT) believes Bitcoin is approaching a decisive moment on the weekly chart....
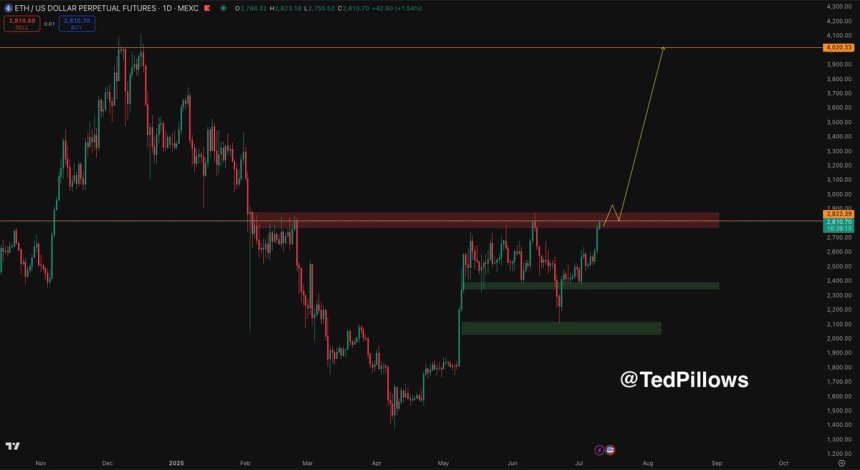
Ethereum Back At Range Highs: Breakout Above $2,800 Could Ignite Altseason
Ethereum surged over 5% yesterday, pushing past the key $2,700 level and signaling renewed strength ...