This Late-Stage Bitcoin Bull Run Signal Hasn’t Shown Up Yet


On-chain data shows the Bitcoin Binary CDD is yet to reach the same peak as during the last few tops in the cryptocurrency’s price.
30-Day MA Of Bitcoin Binary CDD Is Currently Sitting Around 0.6
In a CryptoQuant Quicktake post , an analyst has talked about the latest trend in the Binary CDD for Bitcoin. The “ Coin Days Destroyed ” (CDD) refers to an on-chain indicator that keeps track of the total number of ‘coin days’ being reset across the network.
A coin day is a quantity that one token of the cryptocurrency accumulates after having stayed dormant on the blockchain for one day. When a coin that was previously still for some number of days is moved across the network, its coin days counter naturally resets back to zero, and the coin days that it had accumulated are said to be ‘destroyed.’
Whenever the CDD registers a large spike, it’s a sign that dormant hands on the network are on the move. Generally, the long-term holders only break their silence when they plan to sell, so this kind of trend can prove to be bearish for BTC.
The Binary CDD , the actual indicator of interest in the current discussion, makes it easier to identify whether the current HODLer transaction activity is significant or not when compared to the past.
As its name already suggests, this metric can take on two values: 0 and 1. The Binary CDD is equal to 0 when the CDD is below the historical average and 1 when it’s above.
Note that since the indicator is making a historical comparison, it adds another weighting factor to the CDD: an adjustment with respect to the total circulating supply at the time. This is done because the asset’s supply is going up with time.
Now, here is the chart shared by the quant that shows the trend in the 30-day moving average (MA) of the Bitcoin Binary CDD over the last few years:

As is visible in the above graph, the 30-day MA Bitcoin Binary CDD has been following an upward trajectory recently, implying long-term holders are potentially becoming more active. The increase in the indicator has come as BTC has started on a fresh rally that has taken its price near the all-time high (ATH).
While the long-term holders tend to be resolute entities, they do still come out to take their profits during significant runs. As such, the recent trend in the 30-day MA of the Binary CDD may not be too surprising.
Following the latest continuation to the rise, the metric has hit the 0.60 mark (if the fact that this value is different from the 0 and 1 of the Binary CDD is confusing, consider that this is just an average over 30 days, which would almost always be between these two extremes).
As the analyst has highlighted in the chart, this value is still below the 0.80 level that the indicator breached during both the rally highs from last year, as well as during the euphoria phase of the 2021 bull run .
Given this pattern, it’s possible that the current Bitcoin rally could still have room to grow, at least from the perspective of HODLer distribution.
BTC Price
At the time of writing, Bitcoin is floating around $102,300, up over 3% in the last seven days.

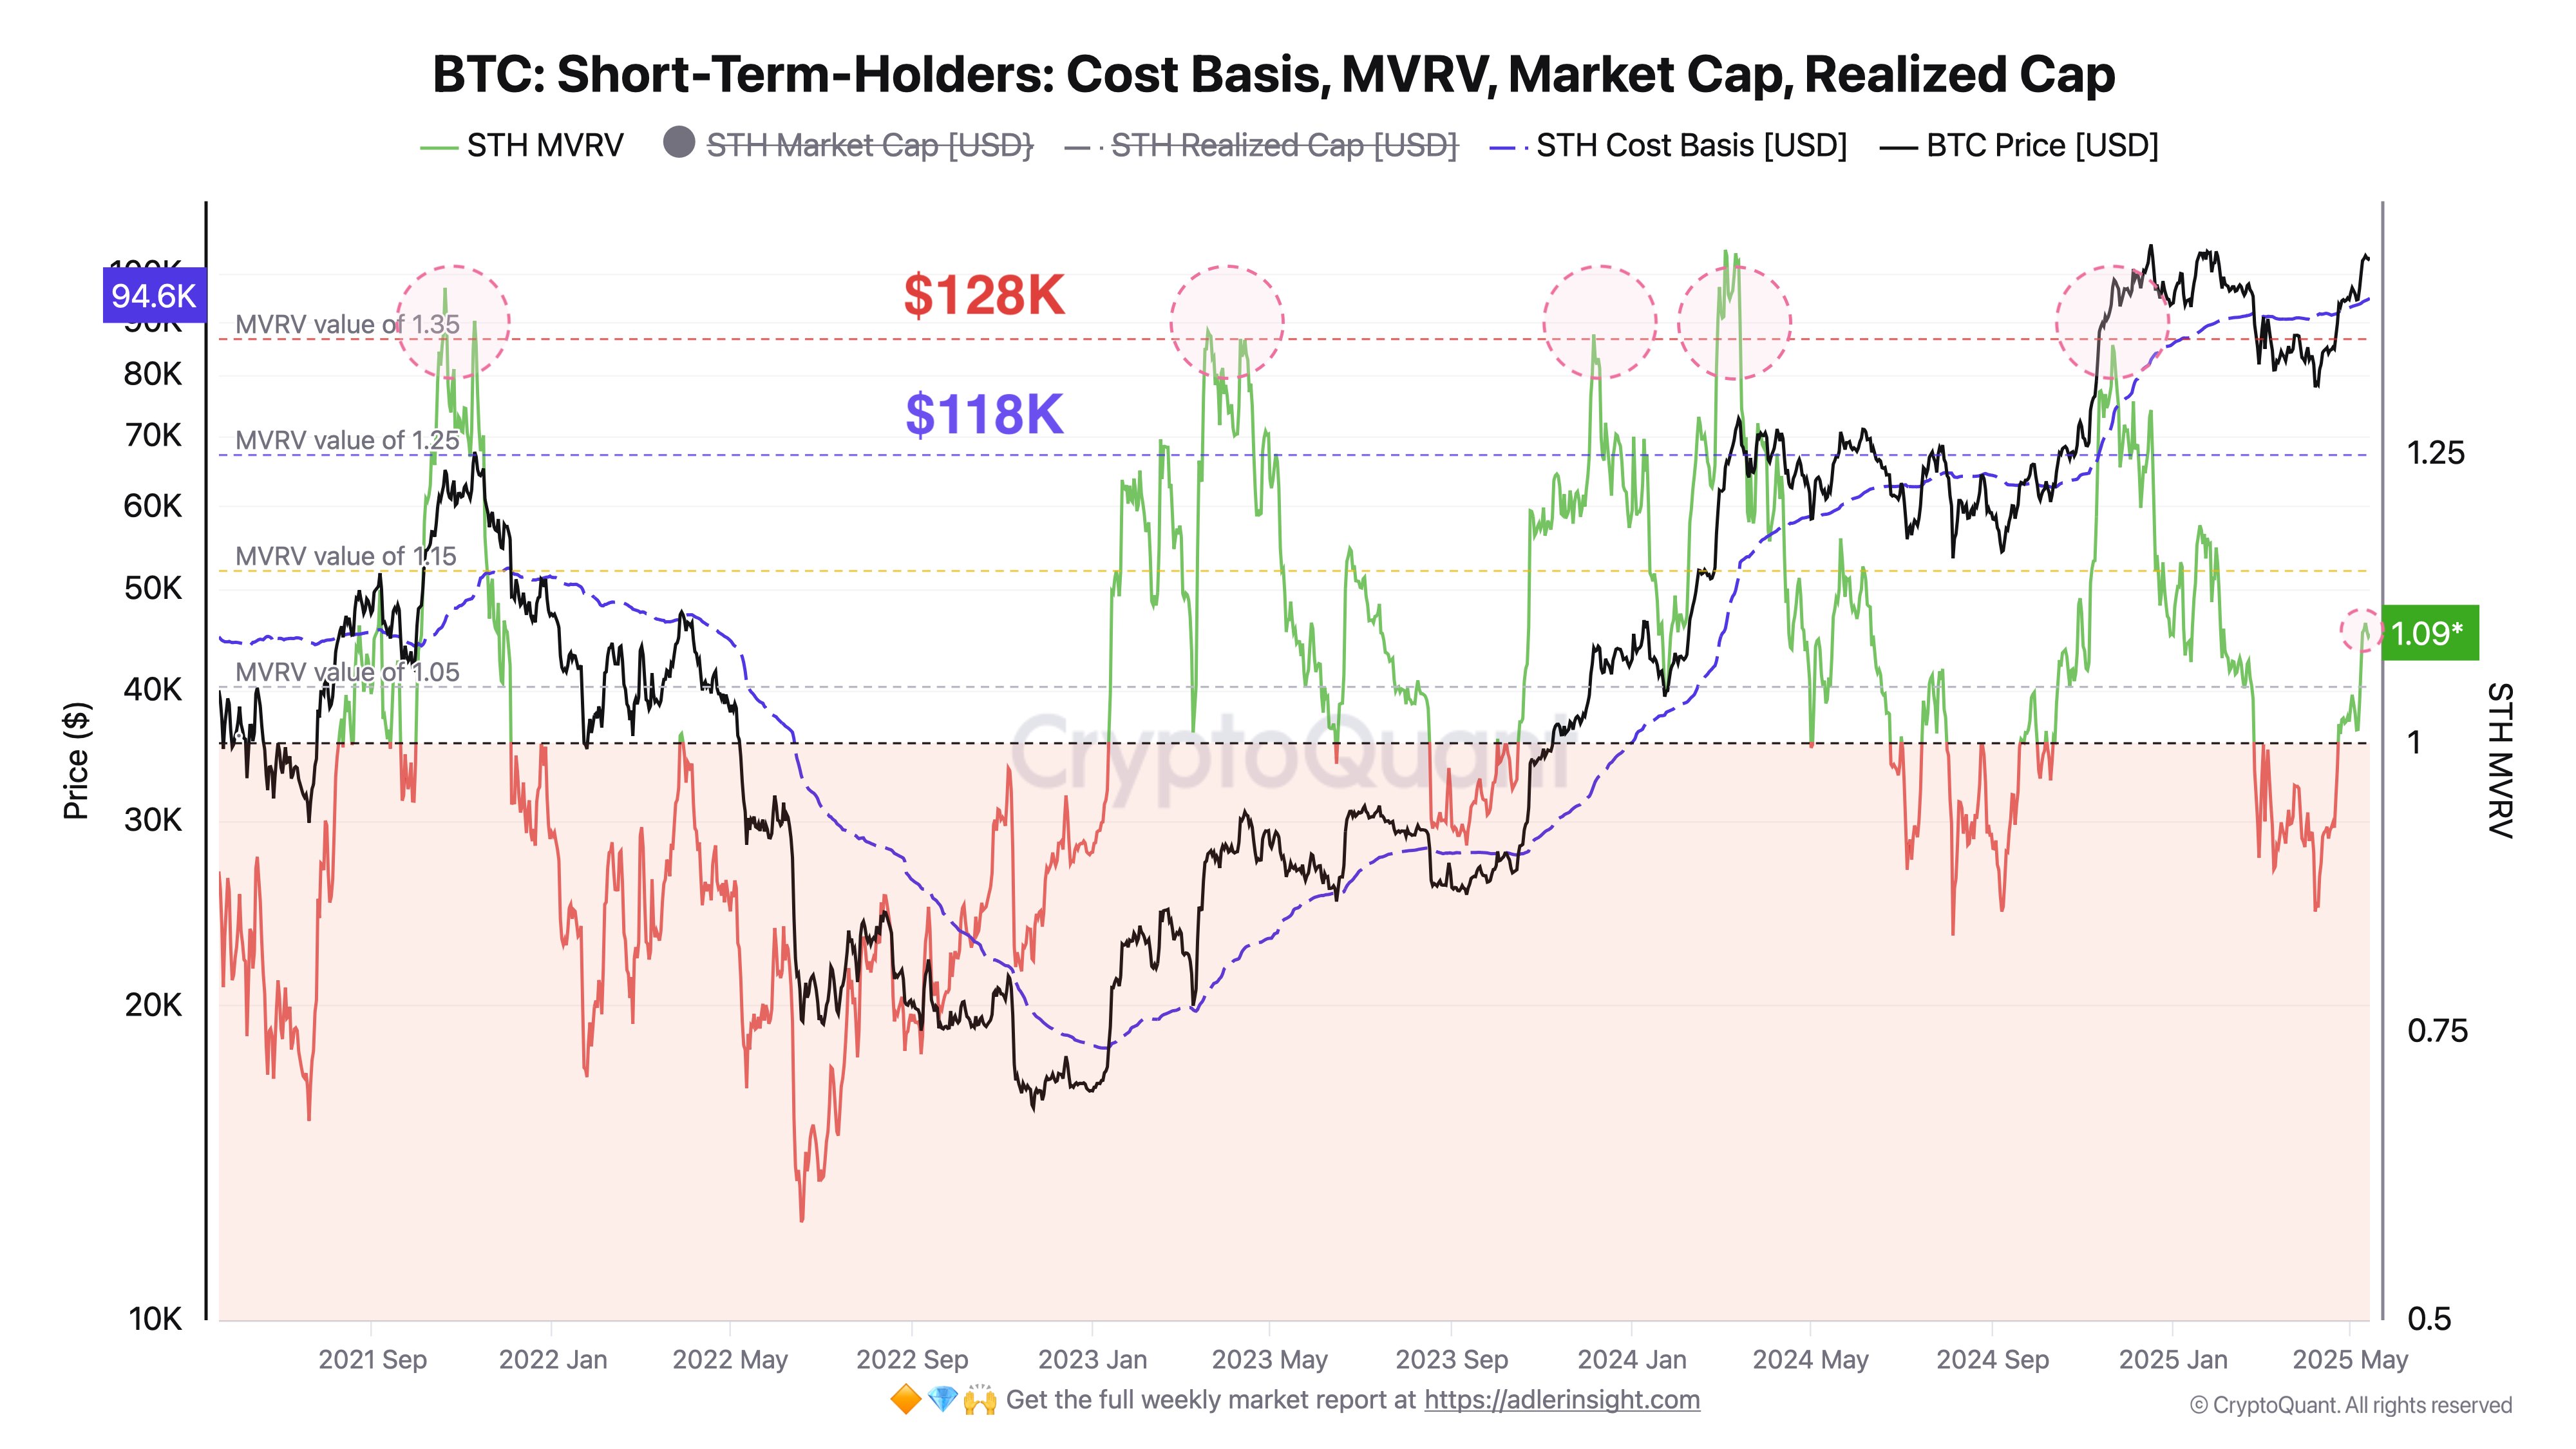
Bitcoin Could See Short-Term Holder Selloff Around These Levels, Analyst Says
An analyst has explained how Bitcoin could face significant waves of selling pressure from the short...

Ethereum Breaks Above Key Realized Price Zones—What It Means for ETH
Ethereum (ETH) experienced a slight price pullback over the past 24 hours, declining by 2.1% to hove...
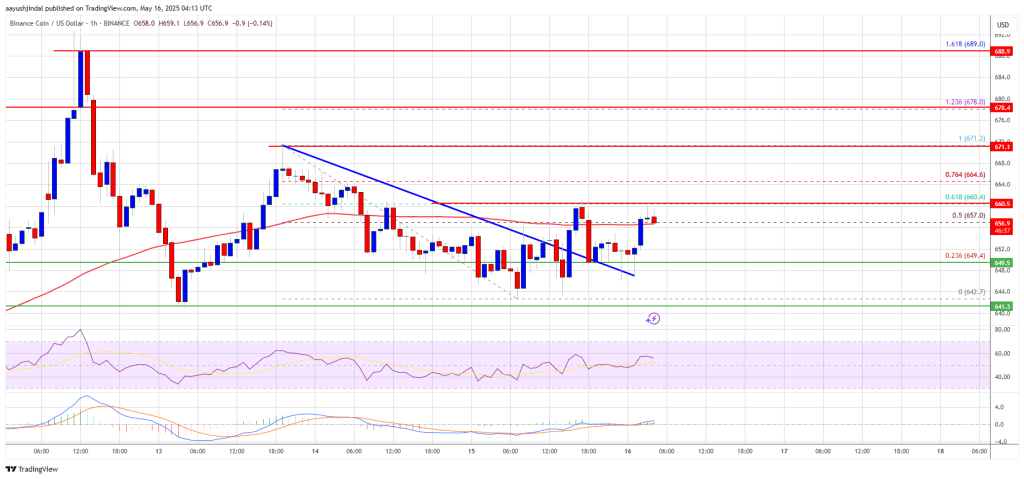
BNB Price Finds Its Footing — Can Bulls Ignite the Next Leg Up?
BNB price is consolidating above the $640 support zone. The price is now showing positive signs and ...