BNB Price Finds Its Footing — Can Bulls Ignite the Next Leg Up?


BNB price is consolidating above the $640 support zone. The price is now showing positive signs and might aim for more gains in the near term.
- BNB price is attempting to recover from the $640 support zone.
- The price is now trading above $655 and the 100-hourly simple moving average.
- There was a break above a connecting bearish trend line with resistance at $652 on the hourly chart of the BNB/USD pair (data source from Binance).
- The pair must stay above the $642 level to start another increase in the near term.
BNB Price Eyes Upside Break
After forming a base above the $642 level, BNB price started a fresh increase. There was a move above the $650 and $655 resistance levels, like Ethereum and Bitcoin .
There was a decent move above the 50% Fib retracement level of the recent decline from the $671 swing high to the $642 low. Besides, there was a break above a connecting bearish trend line with resistance at $652 on the hourly chart of the BNB/USD pair.
The price is now trading above $655 and the 100-hourly simple moving average. On the upside, the price could face resistance near the $660 level. It is close to the 61.8% Fib retracement level of the recent decline from the $671 swing high to the $642 low.
The next resistance sits near the $670 level. A clear move above the $670 zone could send the price higher. In the stated case, BNB price could test $678. A close above the $678 resistance might set the pace for a larger move toward the $685 resistance. Any more gains might call for a test of the $700 level in the near term.
Another Decline?
If BNB fails to clear the $660 resistance, it could start another decline. Initial support on the downside is near the $652 level. The next major support is near the $650 level.
The main support sits at $642. If there is a downside break below the $642 support, the price could drop toward the $630 support. Any more losses could initiate a larger decline toward the $620 level.
Technical Indicators
Hourly MACD – The MACD for BNB/USD is gaining pace in the bullish zone.
Hourly RSI (Relative Strength Index) – The RSI for BNB/USD is currently above the 50 level.
Major Support Levels – $650 and $642.
Major Resistance Levels – $660 and $670.
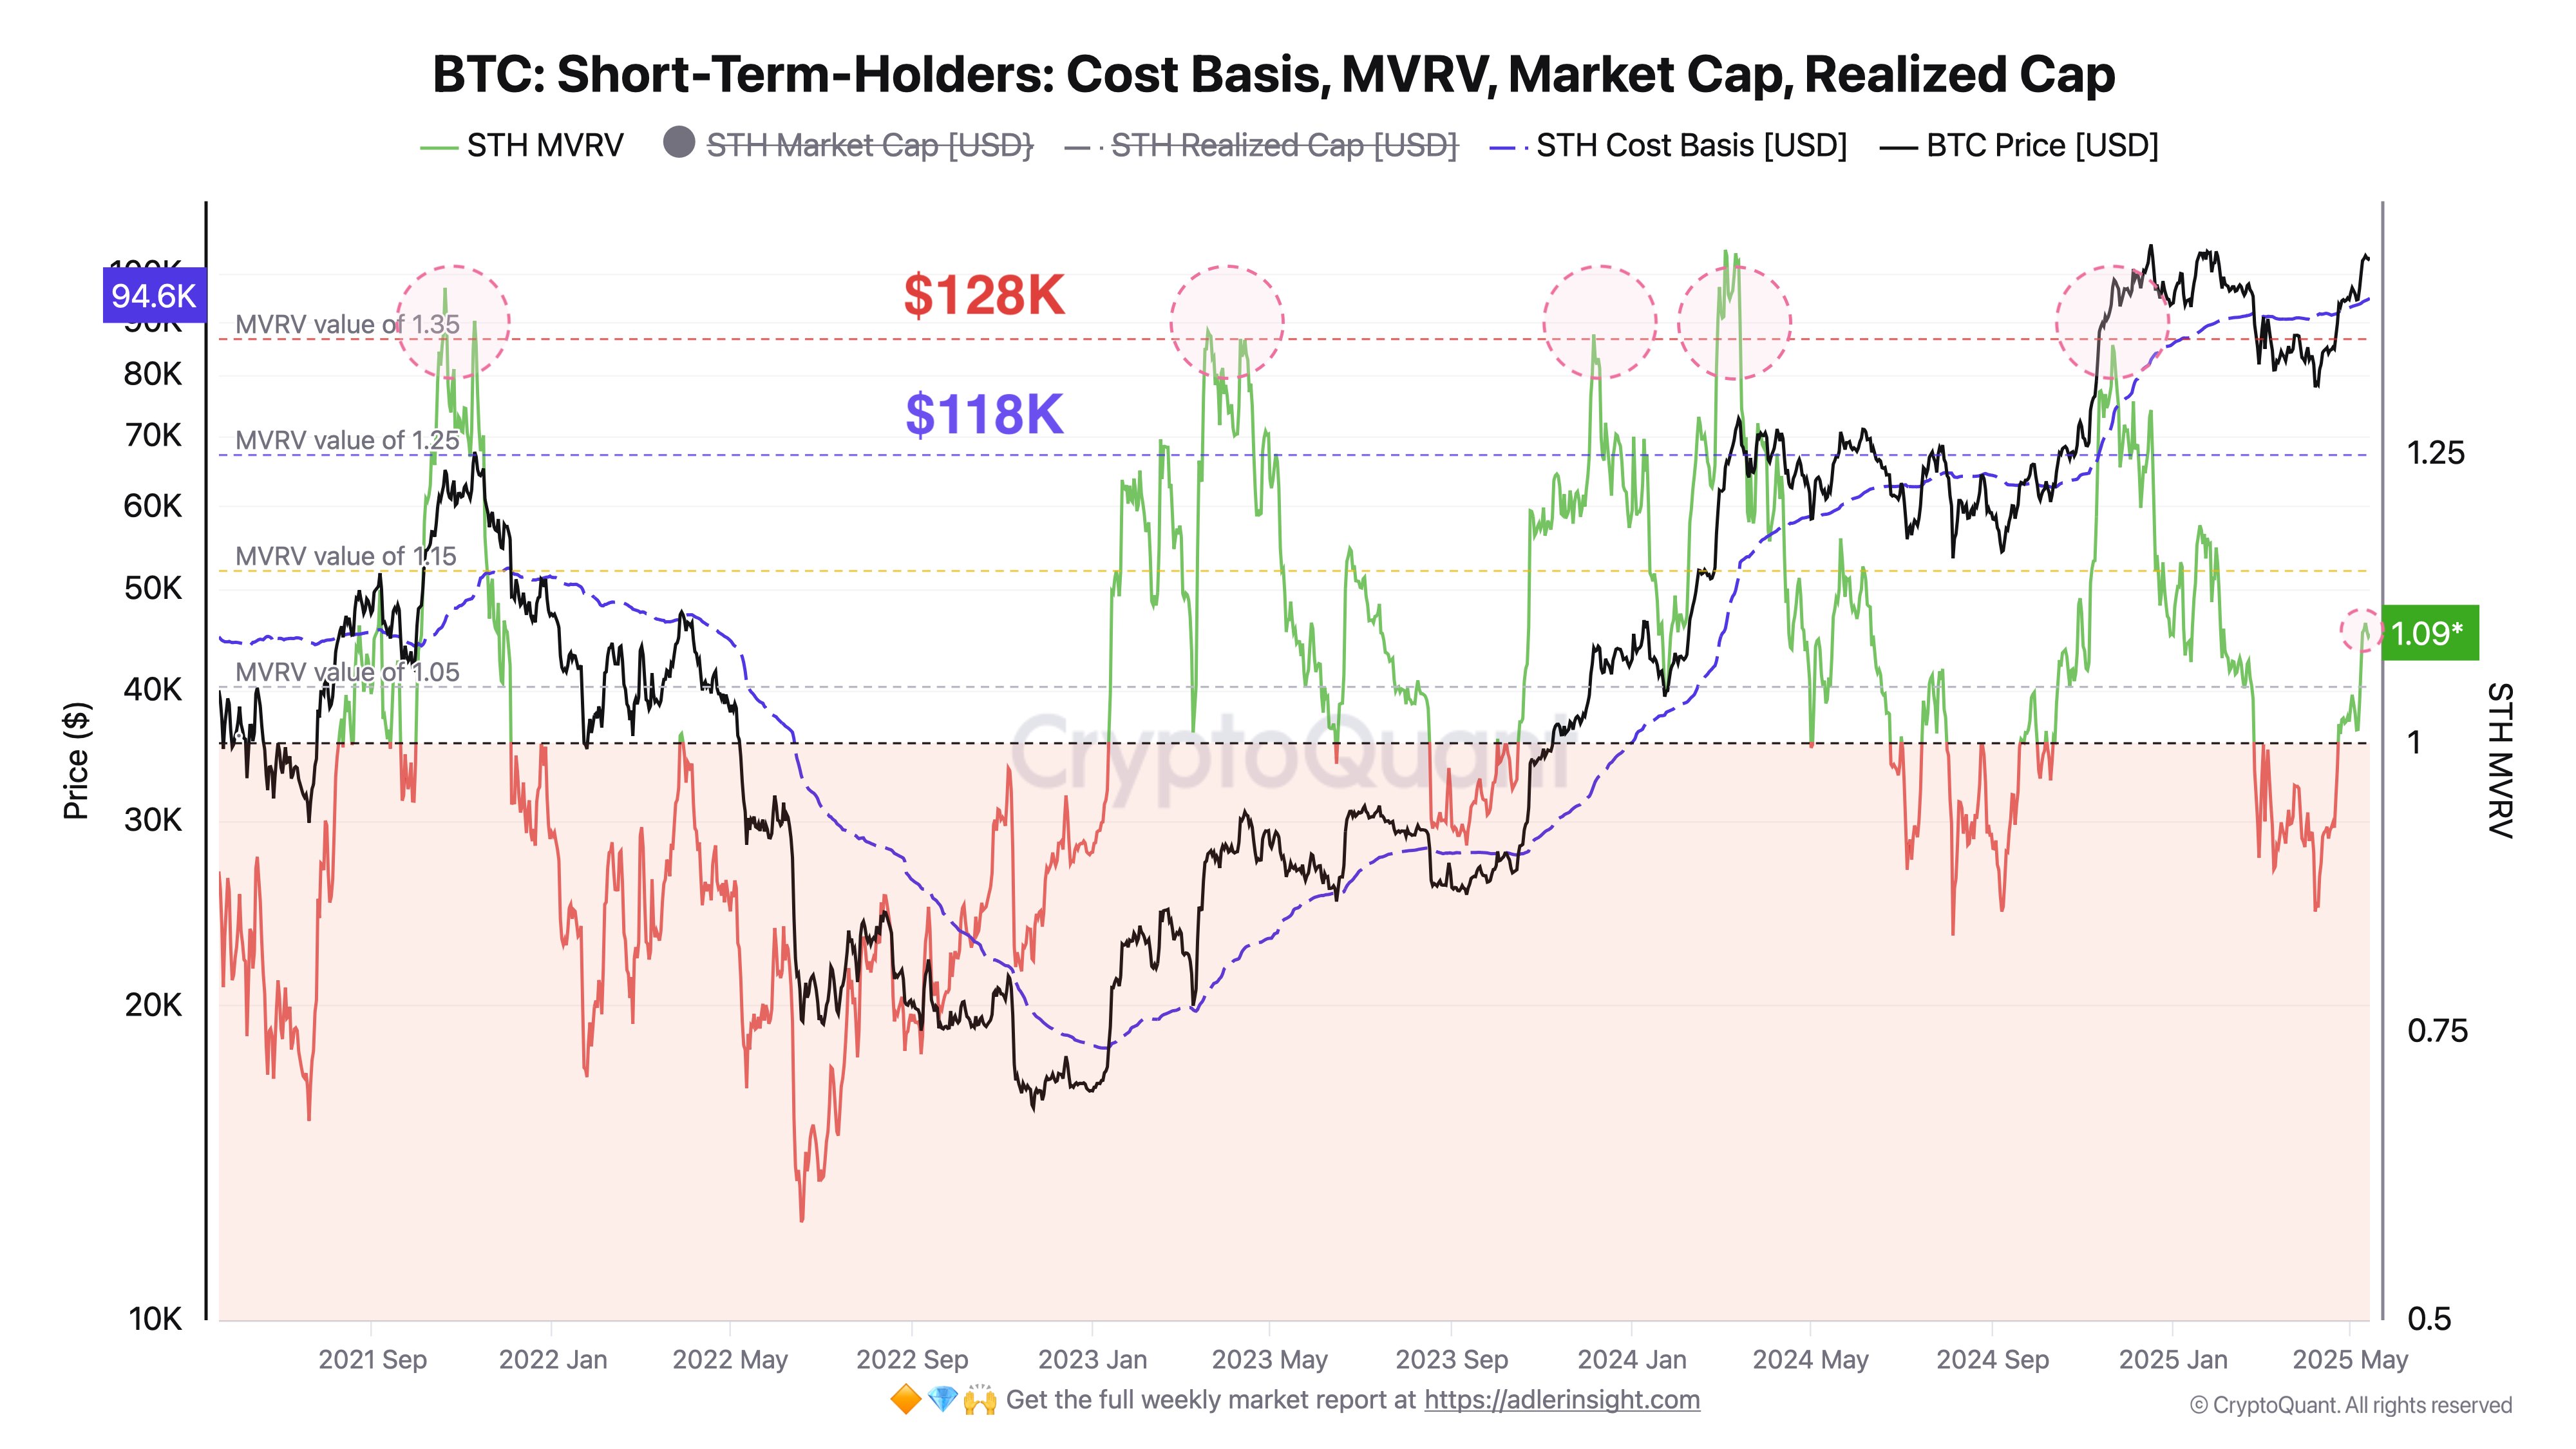
Bitcoin Could See Short-Term Holder Selloff Around These Levels, Analyst Says
An analyst has explained how Bitcoin could face significant waves of selling pressure from the short...

Ethereum Breaks Above Key Realized Price Zones—What It Means for ETH
Ethereum (ETH) experienced a slight price pullback over the past 24 hours, declining by 2.1% to hove...

This Late-Stage Bitcoin Bull Run Signal Hasn’t Shown Up Yet
On-chain data shows the Bitcoin Binary CDD is yet to reach the same peak as during the last few tops...