Bitcoin Price Battles Key Hurdles—Is a Breakout Still Possible?


Bitcoin price started another decline below the $83,500 zone. BTC is now consolidating and might struggle to recover above the $83,850 zone.
- Bitcoin started a fresh decline below the $83,200 support zone.
- The price is trading below $83,000 and the 100 hourly Simple moving average.
- There is a connecting bullish trend line forming with support at $82,550 on the hourly chart of the BTC/USD pair (data feed from Kraken).
- The pair could start another decline if it stays below the $83,850 resistance zone.
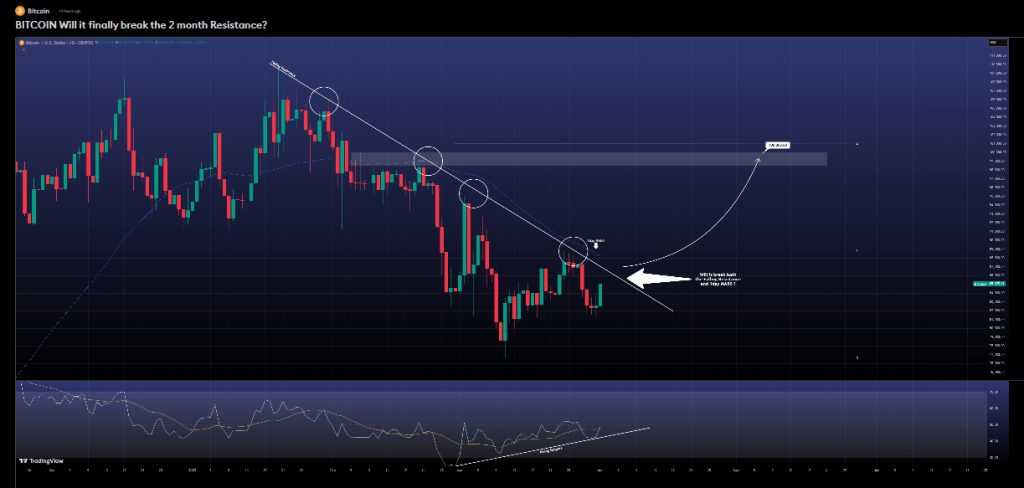
Bitcoin Price Faces Resistance
Bitcoin price failed to start a recovery wave and remained below the $85,500 level . BTC started another decline and traded below the support area at $83,500. The bears gained strength for a move below the $82,500 support zone.
The price even declined below the $82,000 level. A low was formed at $81,320 before there was a recovery wave. There was a move above the $82,500 level, but the bears were active near $83,850. The price is now consolidating and there was a drop below the 50% Fib retracement level of the upward move from the $81,320 swing low to the $83,870 high.
Bitcoin price is now trading below $83,250 and the 100 hourly Simple moving average . There is also a connecting bullish trend line forming with support at $82,550 on the hourly chart of the BTC/USD pair. On the upside, immediate resistance is near the $83,250 level. The first key resistance is near the $83,850 level.
The next key resistance could be $84,200. A close above the $84,200 resistance might send the price further higher. In the stated case, the price could rise and test the $84,800 resistance level. Any more gains might send the price toward the $85,000 level or even $85,500.
Another Decline In BTC?
If Bitcoin fails to rise above the $83,850 resistance zone, it could start a fresh decline. Immediate support on the downside is near the $82,550 level. The first major support is near the $82,250 level and the 61.8% Fib retracement level of the upward move from the $81,320 swing low to the $83,870 high.
The next support is now near the $81,250 zone. Any more losses might send the price toward the $80,000 support in the near term. The main support sits at $78,500.
Technical indicators:
Hourly MACD – The MACD is now losing pace in the bearish zone.
Hourly RSI (Relative Strength Index) – The RSI for BTC/USD is now below the 50 level.
Major Support Levels – $82,250, followed by $81,250.
Major Resistance Levels – $83,250 and $83,850.
Bitcoin Reverses Losses—Analysts Say $100K Is On The Horizon
Bitcoin prices have jumped to $85,020 in the last 24 hours, marking a 1.2% increase that reverses so...
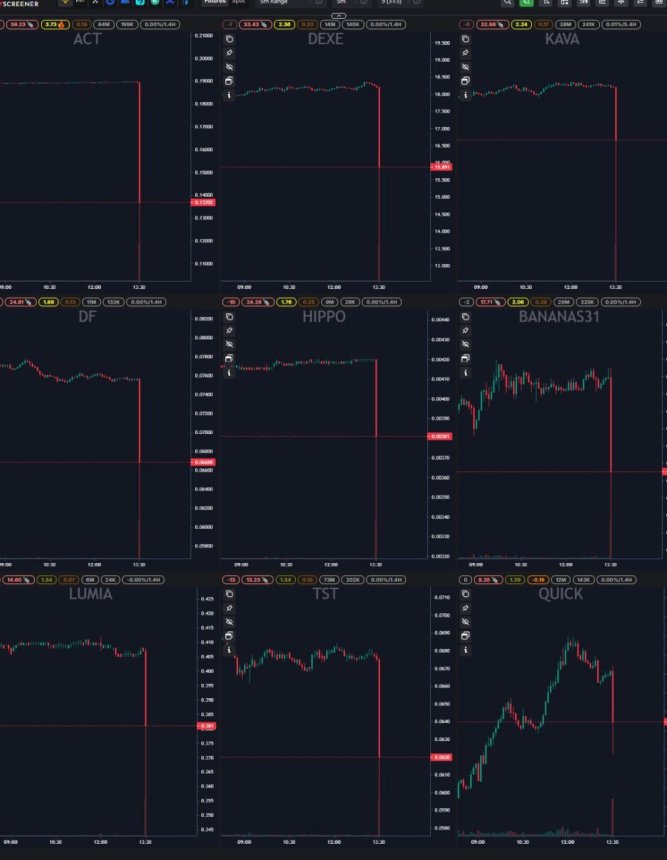
ACT Memecoin Crashes 50% As Several Altcoins Suddenly Tank On Binance – What’s Going On?
On Tuesday morning, several altcoins nosedived up to 50% on global crypto exchange Binance, sparking...
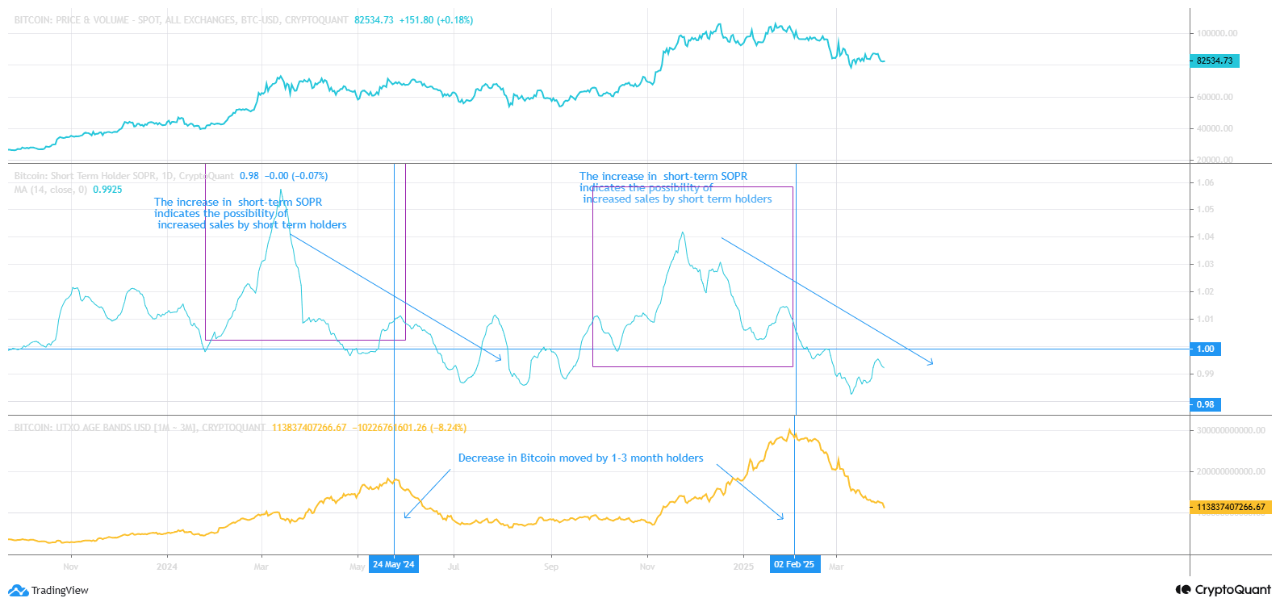
Bitcoin Price Struggling but Short-Term Holders Might Be Setting the Stage for $150K
Bitcoin has recently displayed signs of upward momentum, trading at $85,215, marking a 2.2% increase...