收藏
分享
微信扫一扫
分享到朋友或朋友圈
Elon Musk
@elonmusk
RT
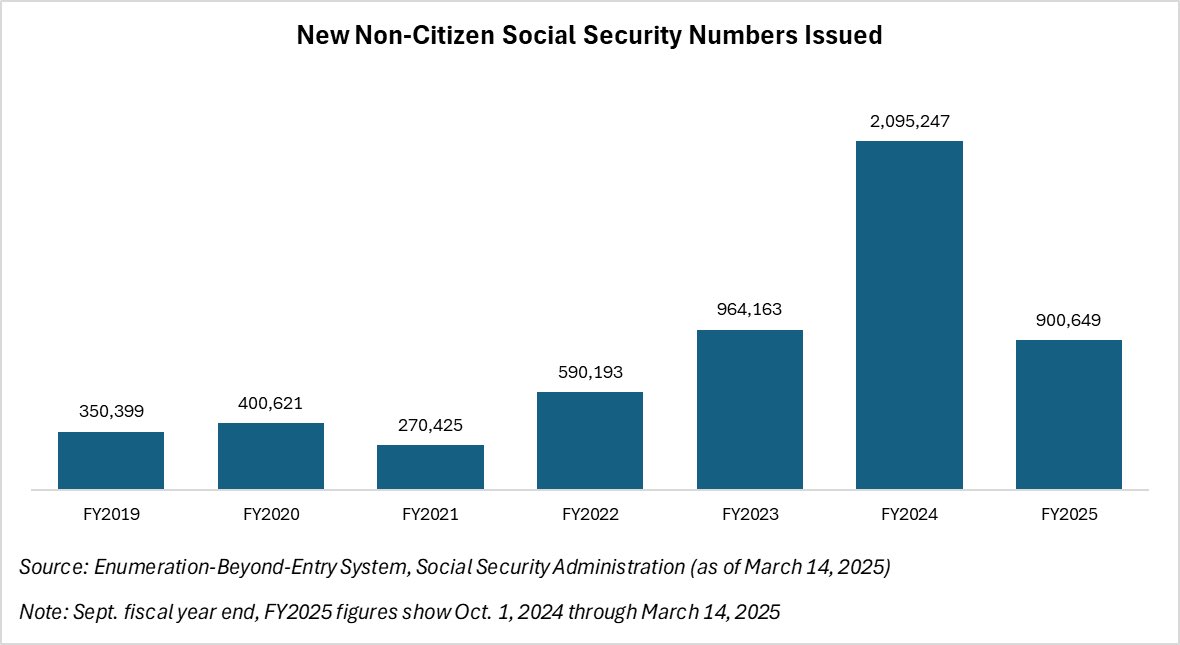
@AntonioGracias: Your data is apples to oranges. The data you show for the 2016 to 2020 period is enumeration for all immigrants in ALL forms. The data we showed in our slide last night in Wisconsin was just Enumeration Beyond Entry ("EBE") immigrants. The difference is Enumerations at Field Offices. These have remained stable at about 1 mln/year excluding COVID. We focused just on EBE because it ramped as a direct result of growth in the various asylum programs. Your chart mixes the two categories: showing all immigrant Enumerations from 2016 thru 2020 and EBE only from 2021 to 2024. Here is the chart back to 2019 for Enumeration Beyond Entry which is when the EBE basically started. I want to thank the good people at the Social Security Administration for their expert help. We would not have been able to understand this complex system without them. There are many terrific people at SSA serving their fellow citizens. We are very grateful. I
@AntonioGracias: Your data is apples to oranges. The data you show for the 2016 to 2020 period is enumeration for all immigrants in ALL forms. The data we showed in our slide last night in Wisconsin was just Enumeration Beyond Entry ("EBE") immigrants. The difference is Enumerations at Field Offices. These have remained stable at about 1 mln/year excluding COVID. We focused just on EBE because it ramped as a direct result of growth in the various asylum programs. Your chart mixes the two categories: showing all immigrant Enumerations from 2016 thru 2020 and EBE only from 2021 to 2024. Here is the chart back to 2019 for Enumeration Beyond Entry which is when the EBE basically started. I want to thank the good people at the Social Security Administration for their expert help. We would not have been able to understand this complex system without them. There are many terrific people at SSA serving their fellow citizens. We are very grateful. I
@AntonioGracias
Your data is apples to oranges. The data you show for the 2016 to 2020 period is enumeration for all immigrants in ALL forms. The data we showed in our slide last night in Wisconsin was just Enumeration Beyond Entry ("EBE") immigrants. The difference is Enumerations at Field Offices. These have remained stable at about 1 mln/year excluding COVID. We focused just on EBE because it ramped as a direct result of growth in the various asylum programs.
Your chart mixes the two categories: showing all immigrant Enumerations from 2016 thru 2020 and EBE only from 2021 to 2024.
Here is the chart back to 2019 for Enumeration Beyond Entry which is when the EBE basically started.
I want to thank the good people at the Social Security Administration for their expert help. We would not have been able to understand this complex system without them. There are many terrific people at SSA serving their fellow citizens. We are very grateful.
I believe these facts speak for themselves. As the son of legal immigrants to America, I am an ardent supporter of legal immigration.
免责声明:本文版权归原作者所有,不代表MyToken(www.mytokencap.com)观点和立场;如有关于内容、版权等问题,请与我们联系。