XRP Price Eyes Breakout: Can It Shatter Resistance and Reignite the Rally?


XRP price found support at $2.20 and started a fresh increase. The price is now gaining pace and might clear the $2.40 resistance zone.
- XRP price started a fresh increase above the $2.250 zone.
- The price is now trading above $2.30 and the 100-hourly Simple Moving Average.
- There is a short-term rising channel forming with support at $2.3650 on the hourly chart of the XRP/USD pair (data source from Kraken).
- The pair might start another increase if there is a close above the $2.420 resistance.
XRP Price Eyes More Gains
XRP price remained supported above the $2.220 level and started a fresh upward wave, like Bitcoin and Ethereum . The price was able to surpass the $2.250 and $2.320 levels.
The bulls pushed the price above the $2.350 resistance zone to set the pace for more gains. Finally, it tested the $2.475 zone. A high was formed at $2.4752 before there was a pullback. The price dipped below $2.40 and tested $2.330. It is again rising with a move above the 23.6% Fib retracement level of the downward move from the $2.4752 swing high to the $2.3310 low.
The price is now trading above $2.350 and the 100-hourly Simple Moving Average. There is also a short-term rising channel forming with support at $2.3650 on the hourly chart of the XRP/USD pair.
On the upside, the price might face resistance near the $2.40 level and the 50% Fib retracement level of the downward move from the $2.4752 swing high to the $2.3310 low. The first major resistance is near the $2.420 level. The next resistance is $2.480.
A clear move above the $2.450 resistance might send the price toward the $2.50 resistance. Any more gains might send the price toward the $2.550 resistance or even $2.6350 in the near term. The next major hurdle for the bulls might be $2.750.
Another Decline?
If XRP fails to clear the $2.420 resistance zone, it could start another decline. Initial support on the downside is near the $2.3650 level. The next major support is near the $2.320 level.
If there is a downside break and a close below the $2.320 level, the price might continue to decline toward the $2.250 support. The next major support sits near the $2.220 zone.
Technical Indicators
Hourly MACD – The MACD for XRP/USD is now gaining pace in the bullish zone.
Hourly RSI (Relative Strength Index) – The RSI for XRP/USD is now above the 50 level.
Major Support Levels – $2.3650 and $2.320.
Major Resistance Levels – $2.420 and $2.480.
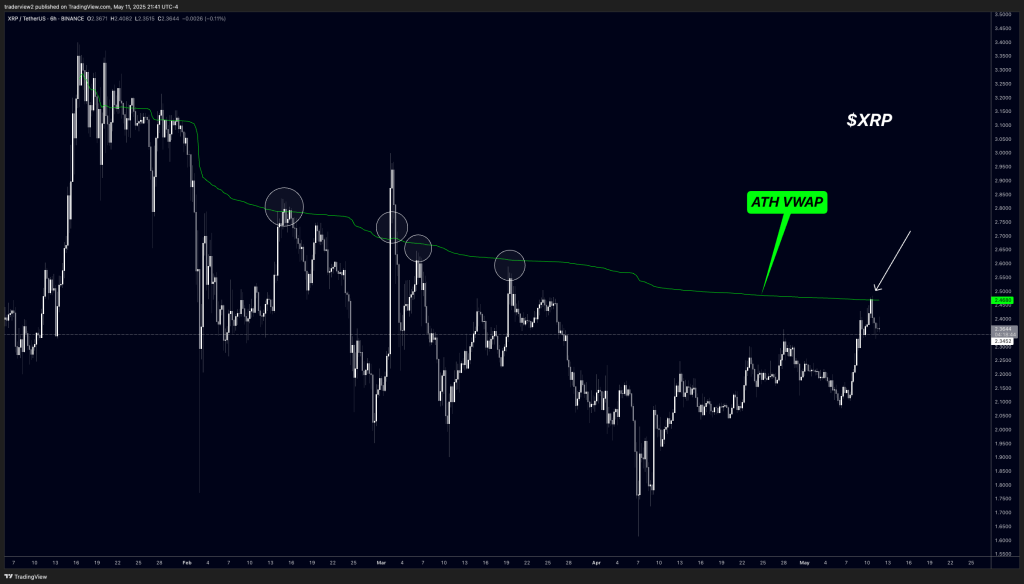
XRP Chart Hits Critical Level That ‘Opens The Sky,’ Analyst Warns
In a fresh update posted on X, market strategist Dom (@traderview2) argues that a single, well-defin...
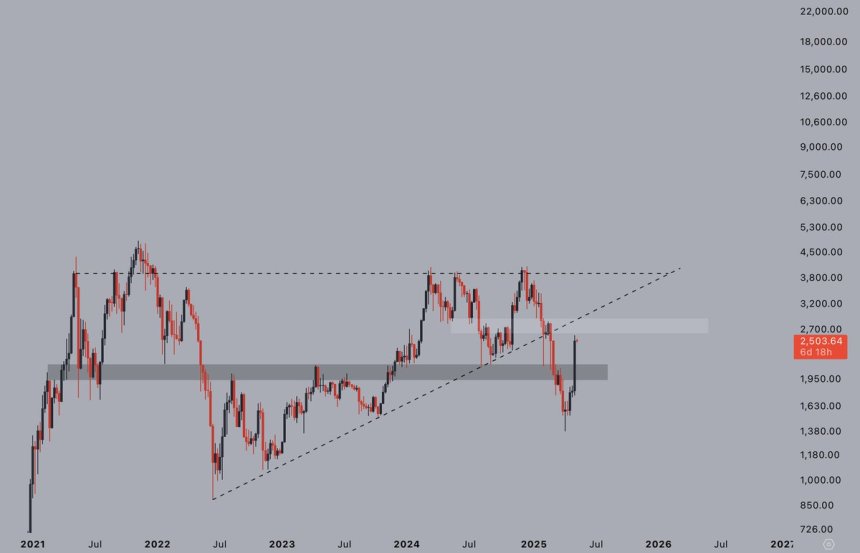
Ethereum Recovery Gains Strength: Massive Comeback Above Key Support
Ethereum is back above the $2,500 level after a massive surge that flipped market sentiment nearly o...
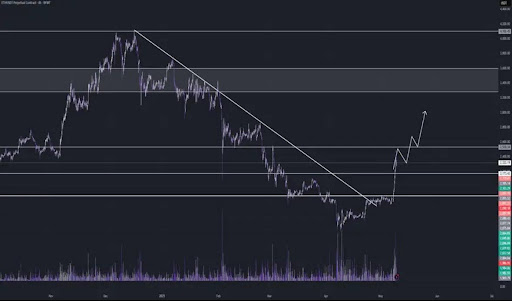
Ethereum Price Completes Bullish Structure Break – $3,000 Comes Next
According to a fresh analysis by a crypto analyst, the Ethereum price has broken out of a months-lo...