
Just before the start of July, the Bitcoin price is approaching a pivotal trendline that may determine its ultimate fate.
After a very difficult month, the existing chart structure suggests a good chance prices will continue to fall.
We are entering the month of Bitcoin's top trading at about $59,500, which is a considerable decrease from its high in the spring.
Factors Shaping Crypto
In the next weeks, three factors will determine market behavior: a bearish chart pattern, falling on-chain demand, and enormous capital outflows.
A cautionary tale based on historical events is the first. With an average gain of 5.90% and a median gain of 2.49%, June has traditionally been a beneficial month for Bitcoin.
But the price of Bitcoin fell almost 19% this month.
In a similar fashion, May started off with a decline of 3.57%, contrasting sharply with the typical rise of 18%. April was the only month in 2026 that exceeded its own median.
This represents a significant shift compared to 2025, when the initial two months of that year concluded on an optimistic note.
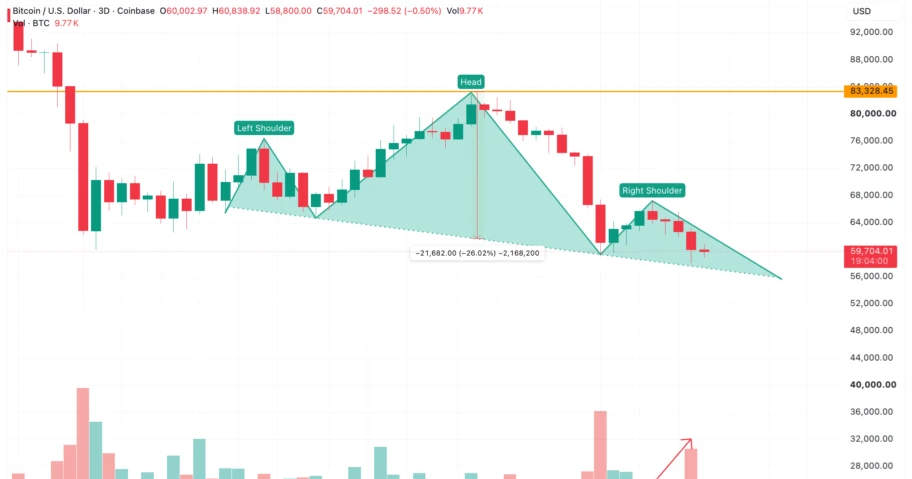
According to TradingView, the Bitcoin price is moving within a bearish head-and-shoulders pattern over the three-day period.
This formation is defined by a high - the head - placed between two lower peaks - the shoulders, and the price is presently slowly approaching the lower trendline.
There was a notable spike in sales volume from June 15th to June 24th, suggesting a possible 26% drop.
Nonetheless, volume alone cannot be considered a dependable signal regarding the potential selling actions of significant stakeholders.
On-chain data points to the impending pressure point.
There has been a local high of about 0.69 for the Bitcoin exchange whale ratio, which is a measure of the proportion of total inflows that come from the top 10 addresses relative to the total.
Following the last rise on June 19, which reached 0.67, Bitcoin fell from $63,481 to $59,501, representing a 6.30% fall. In most cases, a surge in selling pressure is imminent when the ratio rises since it suggests that greater deposits are moving toward exchanges.
There is a parallel pattern in the retail sector.
ETF Sell-Off Hits Crypto
According to The Kobeissi Letter , US gold and Bitcoin ETFs have seen over $12 billion leave the market since April, while semiconductor ETFs have drawn almost $20 billion.
During this period, the largest Bitcoin ETF has lost almost 12% of its value due to investors fleeing to chip stocks.
Everything about the ambience is terrible.
Renowned investor Jeremy Grantham recently described Bitcoin as a “useless, speculative mechanism” that is destined to “dwindle away with a whimper,” reflecting the growing indifference now affecting spot demand.
That alignment of significant capital movements, fund withdrawals, and subdued market sentiment prompts a critical inquiry: Are we facing a sharp downturn or a gradual decline?
Consistent growth is the prevailing trend in the derivatives industry.
Around May 30th, the entire value of active futures contracts for Bitcoin, known as open interest, hit a peak of over $31.3 billion. About $21.6 billion is the current value.
At 0.003%, the financing rate for Bitcoin is marginally positive; it stands for the periodic cost of holding leveraged holdings.
A little leaning towards long positions is indicated by this. Significantly, there is far less leverage available to cause a dramatic liquidation cascade compared to a month ago, as indicated by the decreasing open interest.
Bitcoin is trading at over $59,500, and chart signs point to the possibility of more drops after an almost 19% decrease in June.
The cryptocurrency is also approaching a crucial trendline. If the neckline is broken, a three-day head-and-shoulders pattern, as reported by BeInCrypto, indicates a possible downside of almost 26%.
Furthermore, the exchange whale ratio has hit a new low of about 0.69, and June saw record-high outflows of $4.06 billion from US spot Bitcoin ETFs, the highest monthly total since the fund's launch.
The breakdown would be confirmed by a closing below $55,298 according to BeInCrypto.
Support levels are around $52,458 and $48,413, while the anticipated objective is approximately $42,000. But if you were to regain the $61,654 and $67,335 levels, this situation would be null and void.
Institutional spot flows, not leverage, are feeling the heat.
Massive Exodus from Bitcoin ETFs Extends the Drag
This departure has never happened before.
With about $4.06 billion flowing out of US spot Bitcoin ETFs in June, it was the most liquid month since the funds were first introduced.
This amount is more than the previous record, which was achieved in February 2025 and was $3.56 billion.
The persistent flight of capital sheds light on the seemingly constant rather than erratic downward pressure on the Bitcoin price forecast, which is explained by the data from whales and the change in retail investment.
Price Bets For July
Here is when the levels become important. The head and shoulders design suggests a possible 26% movement in the event that the neckline is broken. Whether or not Bitcoin reaches that mark will determine the July value projection.
A collapse would be verified if the price closed below $55,298—the 0.5 Fibonacci barrier. Following it are $52,458 and $48,413, which will lead to the expected goal of around $42,000.
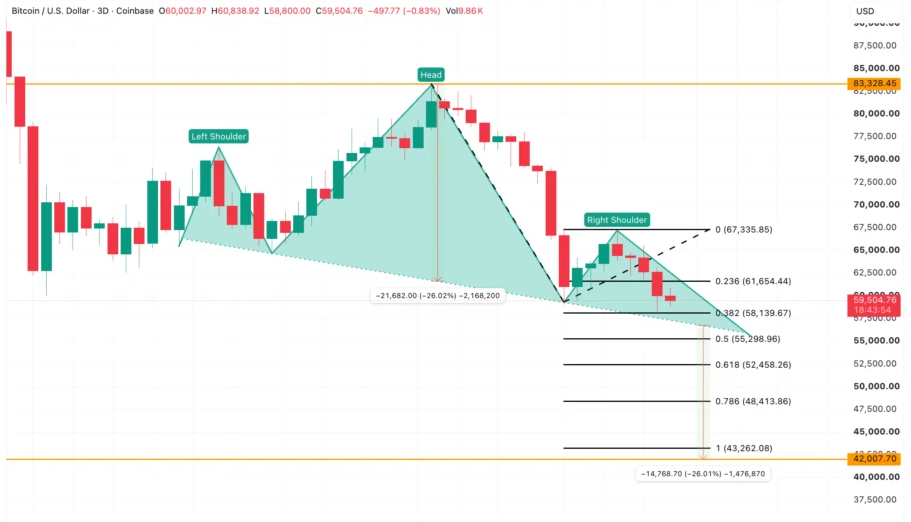
Buyers must recoup $61,654 and then $67,335 to defy the existing arrangement.
Here, a nuanced difference is at work.
Since head-and-shoulders breakdowns don't always work, and open interest is now low, a big short squeeze might happen.
At $55,298, we can see a slight lateral shift away from a possible 26% drop to the $42,000 region.
Bitcoin Bottom, Anyone?
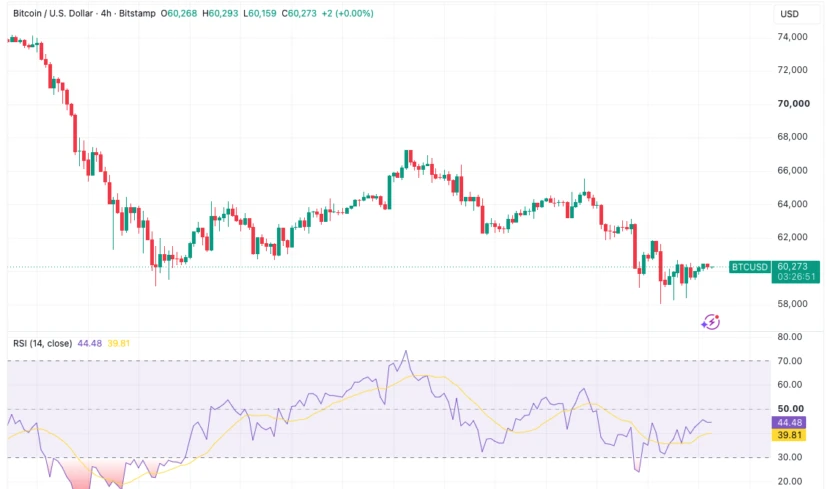
Bitcoin's price continued its fight towards the $60,000 level, with certain chart signs suggesting a possible comeback.
According to TradingView, hourly charts show a series of high swing lows, with positive signals from the relative strength index (RSI) indicator.
A bullish divergence was noted on the four-hour chart, as the RSI formed lower lows while the price formed higher lows. Because of this, market players became interested in the possibility of a Bitcoin price reversal. unknown component
Crypto trader known only as "Rod" uploaded a chart that he said showed a striking resemblance between the present market downturn and the one in 2022.
$BTC
— Rod (@Crypto_R0D) June 26, 2026
Once you see it, you can't unsee it
It's 2022 again. pic.twitter.com/1CeBRdGWnN
The market eventually found support when BTCUSD hit its bear-market low of $15,600, coinciding with the appearance of a weekly RSI positive divergence.
In early June, the four-hour RSI hit a record low of 11.4—a level never before seen.
Friday saw the addition of daily time periods to the mix of RSI bull indications by crypto expert Lukasz Wydra.
On the Bitcoin chart, the bullish RSI divergence is now formally established. While it may yet go further, he assured X fans that Binance's defence of the price was unwavering.
According to Wydra, the RSI indications are a positive indicator.
Some traders remained committed to their current forecasts, anticipating that additional downward pressure would emerge sooner or later.
Niels Klaver, cofounder of the crypto platform STABL Agency, reiterated the need for a rise to $55,000 “before any significant shift” can occur to alter the current landscape.
What Other Technical Readings Show
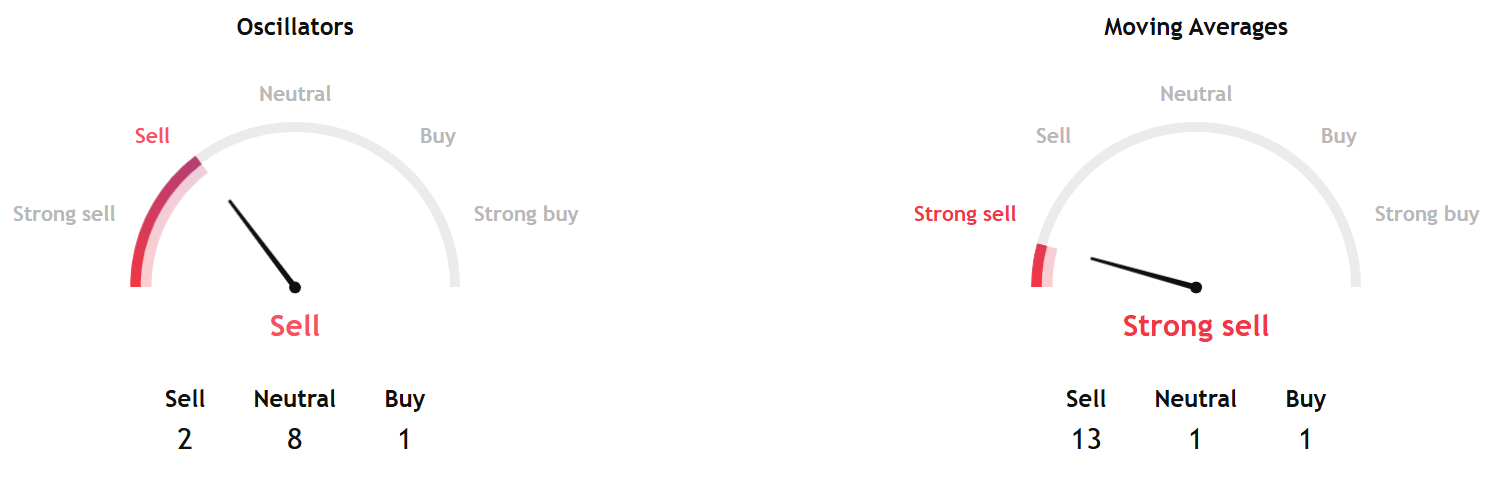
TradingView's Bitcoin technical analysis overview for the week ahead, based on key data from moving averages, oscillators, and pivots, showed a sell signal.
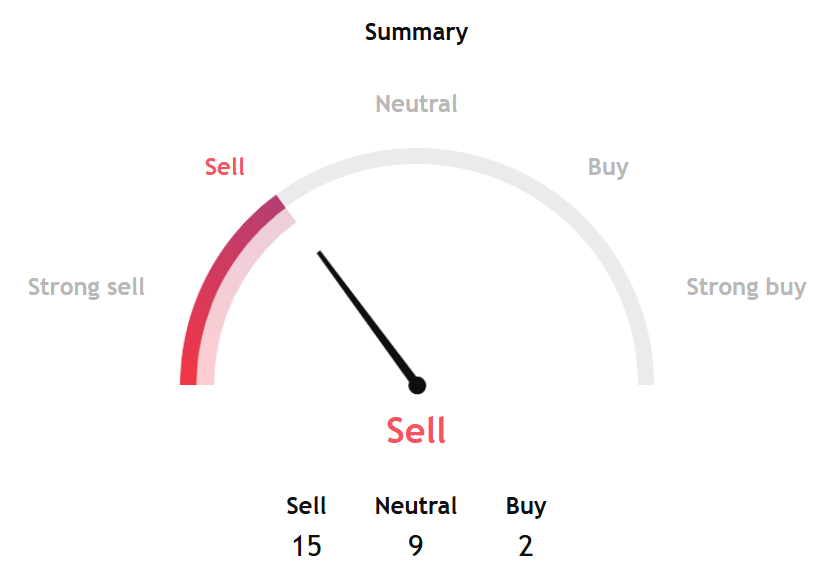
Both short- and long-term gauges pointed to a sell stance.
Separately, InvestTech's Algorithmic Overall Analysis and one to six weeks' recommendation gave a negative score.
"Bitcoin shows weak development in a falling trend channel in the short term. Falling trends indicate that the currency experiences negative development and falling buying interest among investors. The currency has broken through support at $61,000. This predicts a further decline."
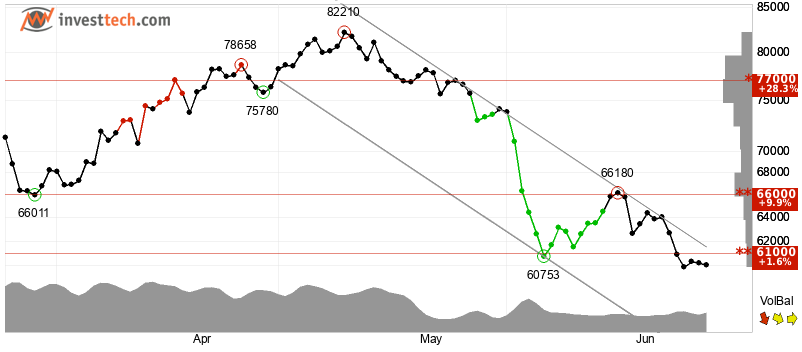
InvestTech added, "In case of positive reactions, there will now be resistance at $61,000. The RSI curve shows a falling trend, which supports the negative trend. The currency is overall assessed as technically negative for the short term."