Data shows social media sentiment around Solana has been rising recently, but network utility has actually followed the opposite path.
Solana Active Addresses Have Been On The Decline
In a new post on X, analytics firm Santiment has talked about how a couple of key metrics related to Solana have changed recently. The indicators in question are the Positive/Negative Sentiment and Daily Active Addresses.
First, the Positive/Negative Sentiment compares the bullish and bearish sentiments related to a given asset that are currently present on the major social media platforms. The indicator works by first separating positive and negative comments containing mentions of the asset using a machine-learning model and then taking the ratio of their counts.
As the chart below shows, the Positive/Negative Sentiment has been going up for Solana recently, implying an improvement in investor mood around the cryptocurrency.

Back in February, the indicator had plummeted for Solana as a consequence of the price crash. But even then, its value didn’t drop below the 1 level, meaning that sentiment never outright turned bearish, at least from the perspective of this metric.
From the graph, it’s visible that the improvement in sentiment was gradual at first, but April saw an accelerated recovery. Today, the Positive/Negative Sentiment is sitting at about 3.2, which indicates that social media users are making more than three bullish posts for every bearish comment. “There is a growing narrative that the asset is primed for a breakout after trailing Bitcoin and other large caps, and regressing to the mean,” noted Santiment.
While sentiment surrounding Solana has surged, the other indicator displayed in the chart, the Daily Active Addresses , has plummeted instead. This metric measures the total number of addresses taking part in some kind of transaction activity on the network every day. It would appear that user participation on the SOL blockchain shot up in January and reached a peak alongside the bottom in February. This trend wasn’t surprising, as volatile price action tends to attract trader attention.
As the digital asset sector as a whole fell into a phase of consolidation following the February low, the Daily Active Addresses naturally declined as investors lost interest in the market. Recently, the metric has plunged to especially low levels, reflecting muted activity on the blockchain. More specifically, there have been just 2.89 million addresses that made transactions during the past week. For comparison, the indicator’s value was 5.01 million during the February high.
With the Daily Active Addresses sitting at a 4-month low right now, it remains to be seen whether the bullish outcome that the social media crowd is hoping for will follow for Solana.
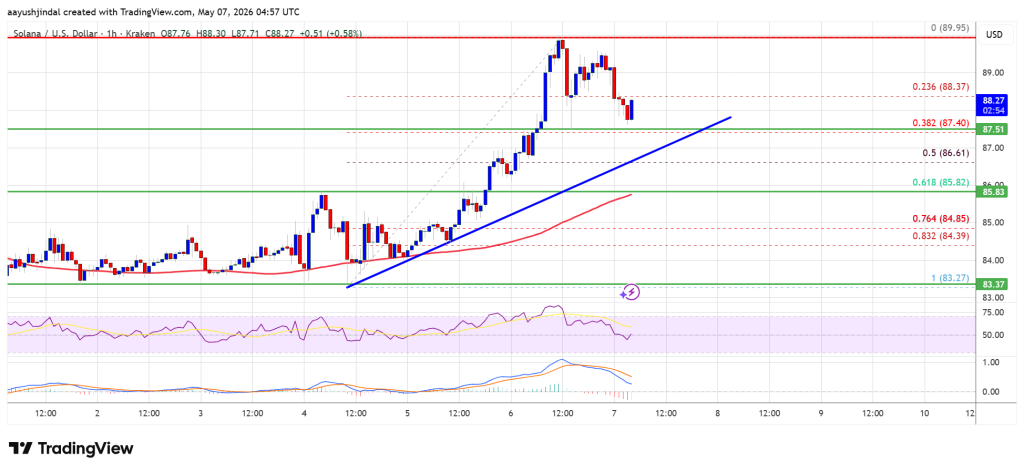
SOL Price
At the time of writing, Solana is trading around $89, up more than 5% in the last 24 hours.