Bitcoin Slides Back to $100K — Is the Parabolic Run Finally Cracking?


Bitcoin price is gaining bearish pace below $103,500. BTC could continue to move down if it stays below the $103,500 resistance.
- Bitcoin started a fresh decline below the $105,000 support.
- The price is trading below $104,000 and the 100 hourly Simple moving average.
- There is a bearish trend line forming with resistance at $103,500 on the hourly chart of the BTC/USD pair (data feed from Kraken).
- The pair might continue to move down if it settles below the $100,000 zone.
Bitcoin Price Dips Again
Bitcoin price failed to stay above the $105,500 support level and started a fresh decline . BTC dipped below $104,000 and $103,500 to enter a bearish zone.
The decline was such that the price even spiked below the $100,000 support. A low was formed at $98,900 and the price is now consolidating losses near the 23.6% Fib retracement level of the downward move from the $111,000 swing high to the $98,900 low.
Bitcoin is now trading below $104,000 and the 100 hourly Simple moving average. If the bulls attempt a recovery wave, the price could face resistance near the $102,000 level. The first key resistance is near the $103,500 level. There is also a bearish trend line forming with resistance at $103,500 on the hourly chart of the BTC/USD pair.
The next resistance could be $105,000 and the 50% Fib retracement level of the downward move from the $111,000 swing high to the $98,900 low. A close above the $105,000 resistance might send the price further higher. In the stated case, the price could rise and test the $106,400 resistance. Any more gains might send the price toward the $107,500 level. The next barrier for the bulls could be $108,500 and $108,800.
More Losses In BTC?
If Bitcoin fails to rise above the $103,500 resistance zone, it could continue to move down. Immediate support is near the $100,200 level. The first major support is near the $100,000 level.
The next support is now near the $98,800 zone. Any more losses might send the price toward the $96,200 support in the near term. The main support sits at $95,500, below which BTC might struggle to recover in the near term.
Technical indicators:
Hourly MACD – The MACD is now gaining pace in the bearish zone.
Hourly RSI (Relative Strength Index) – The RSI for BTC/USD is now below the 50 level.
Major Support Levels – $100,200, followed by $100,000.
Major Resistance Levels – $103,500 and $105,000.
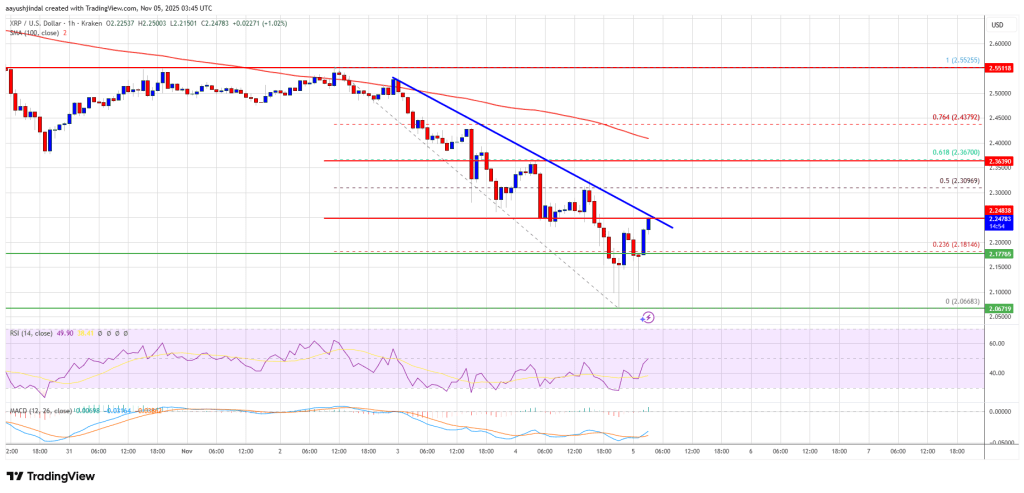
XRP Price Targets Bounce; Traders Watch $2.30 Resistance Level
XRP price started a fresh decline below $2.350. The price is now showing bearish signs and is at ris...
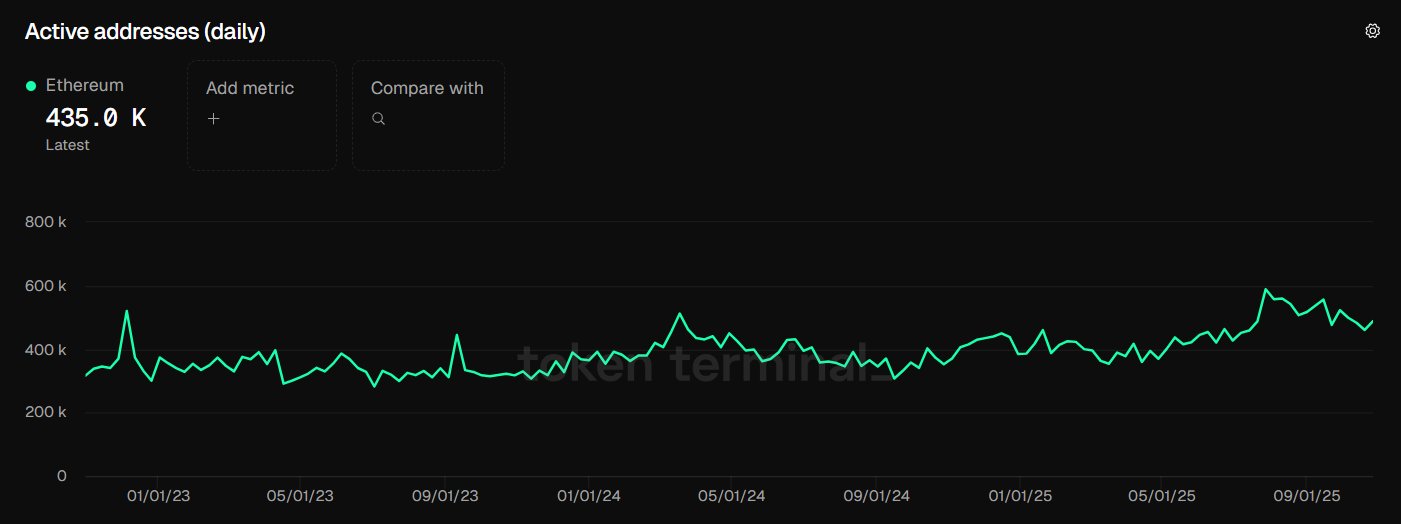
Altcoin Winter Here? Ethereum, Solana Activity Plunges
On-chain data shows signs of an altcoin winter may be emerging as Ethereum, Solana, and other crypto...
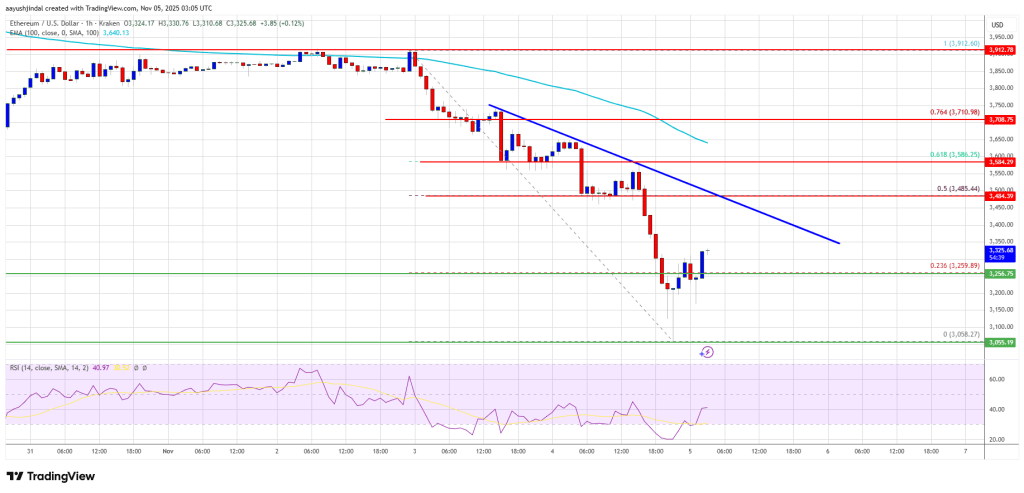
Ethereum Tanks 10% — Can Bulls Defend the Next Major Demand Zone?
Ethereum price started a fresh decline below $3,550. ETH is struggling below $3,400 and might declin...