Bitcoin Records Over $300B Spot Volume In October – Investors Shift Away From Leverage


Bitcoin (BTC) has seen heightened volatility following the US Federal Reserve’s decision to cut interest rates by 25 basis points and announce the official end of quantitative tightening (QT) by December 1st. The move marks a pivotal shift in US monetary policy as the central bank signals the beginning of a more supportive liquidity cycle after months of restrictive financial conditions. Traders reacted sharply across risk assets, with Bitcoin initially spiking before retracing as markets reassessed the implications of renewed liquidity and shifting economic expectations.
Meanwhile, fresh data from CryptoQuant highlights a powerful underlying trend in the Bitcoin market. October has witnessed a meaningful surge in spot trading activity, particularly on Binance, where participation has climbed sharply. Across major centralized exchanges, Bitcoin spot volume surpassed $300 billion this month, with Binance alone accounting for $174 billion. This makes October the second-highest spot volume month of the year, underscoring renewed trader confidence and a shift toward direct Bitcoin exposure rather than leveraged speculation.
This strengthening in spot market flows signals improving market structure and growing conviction among participants. With liquidity expected to increase heading into year-end, investors are positioning for what could be the next major phase in Bitcoin’s macro-driven cycle.
Bitcoin Spot Market Strength Signals Healthier Market Structure
According to top analyst Darkfost, the recent surge in Bitcoin spot volume underscores a growing wave of participation from both retail traders and institutional players, who have become increasingly active outside leveraged markets. This shift is most visible on Binance, which continues to dominate spot trading across centralized exchanges. Its deep liquidity, global retail base, and institutional pipelines remain unmatched, reinforcing its position as the primary venue for real Bitcoin demand.

One key catalyst behind this pivot toward spot exposure was the historic liquidation event on October 10th—the largest in crypto history. The magnitude of that wipeout forced many traders to reassess risk. It became a clear reminder that excessive leverage can amplify losses far more quickly than it generates gains, especially in a market as volatile and structurally reflexive as Bitcoin. In response, market participants appear to have shifted toward a more conservative posture. Choosing to accumulate BTC directly rather than chase high-leverage positions.
This trend is meaningful for Bitcoin’s long-term trajectory. A market driven primarily by spot flows instead of derivatives tends to be more stable, more sustainable, and less prone to sudden liquidation cascades. Elevated spot participation also signals genuine organic demand, rather than speculative interest reliant on borrowed capital. Historically, periods where spot volume leads have aligned with structural accumulation phases and strengthened market bottoms. This could be laying the foundation for durable bull cycles.
If this rotation continues, Bitcoin may be entering a phase defined by healthier price discovery and stronger investor conviction. Supported by growing liquidity and improved market resilience. An encouraging backdrop as the macro environment shifts in favor of risk assets.
Bitcoin Price Pulls Back Toward Key Support Zone
Bitcoin (BTC) is trading near $110,800 after facing firm rejection at the $117,500 resistance level earlier this week. The 4-hour chart shows BTC rolling over from this supply zone and dropping below the 50-period moving average. Signaling weakening short-term momentum. Price is now testing a critical support range between $110,000 and $111,000, which previously acted as a key demand zone in mid-October.

Below current levels, the 100-period (green) and 200-period (red) moving averages sit around $109,500–$108,500, forming a critical confluence of support. If Bitcoin can hold this region, it may reset and attempt another push higher once market volatility settles post-Fed. A decisive break below $108,000 would likely expose BTC to deeper downside. Opening the door to a move toward $105,000 or even $102,500.
On the upside, bulls must reclaim the $113,500–$114,500 area to regain traction. A sustained move above this zone would put $117,500 back into focus. With a breakout, there is potential to fuel continuation toward the $120,000–$123,000 range.
Featured image from ChatGPT, chart from TradingView.com

XRP And Solana Set New $3 Billion All-Time High As Interest Explodes
The open interest in XRP and Solana (SOL) futures and options has reached a record $3 billion on the...

Bitcoin Struggles To Hold Key Support: Could $88,000 Be Next?
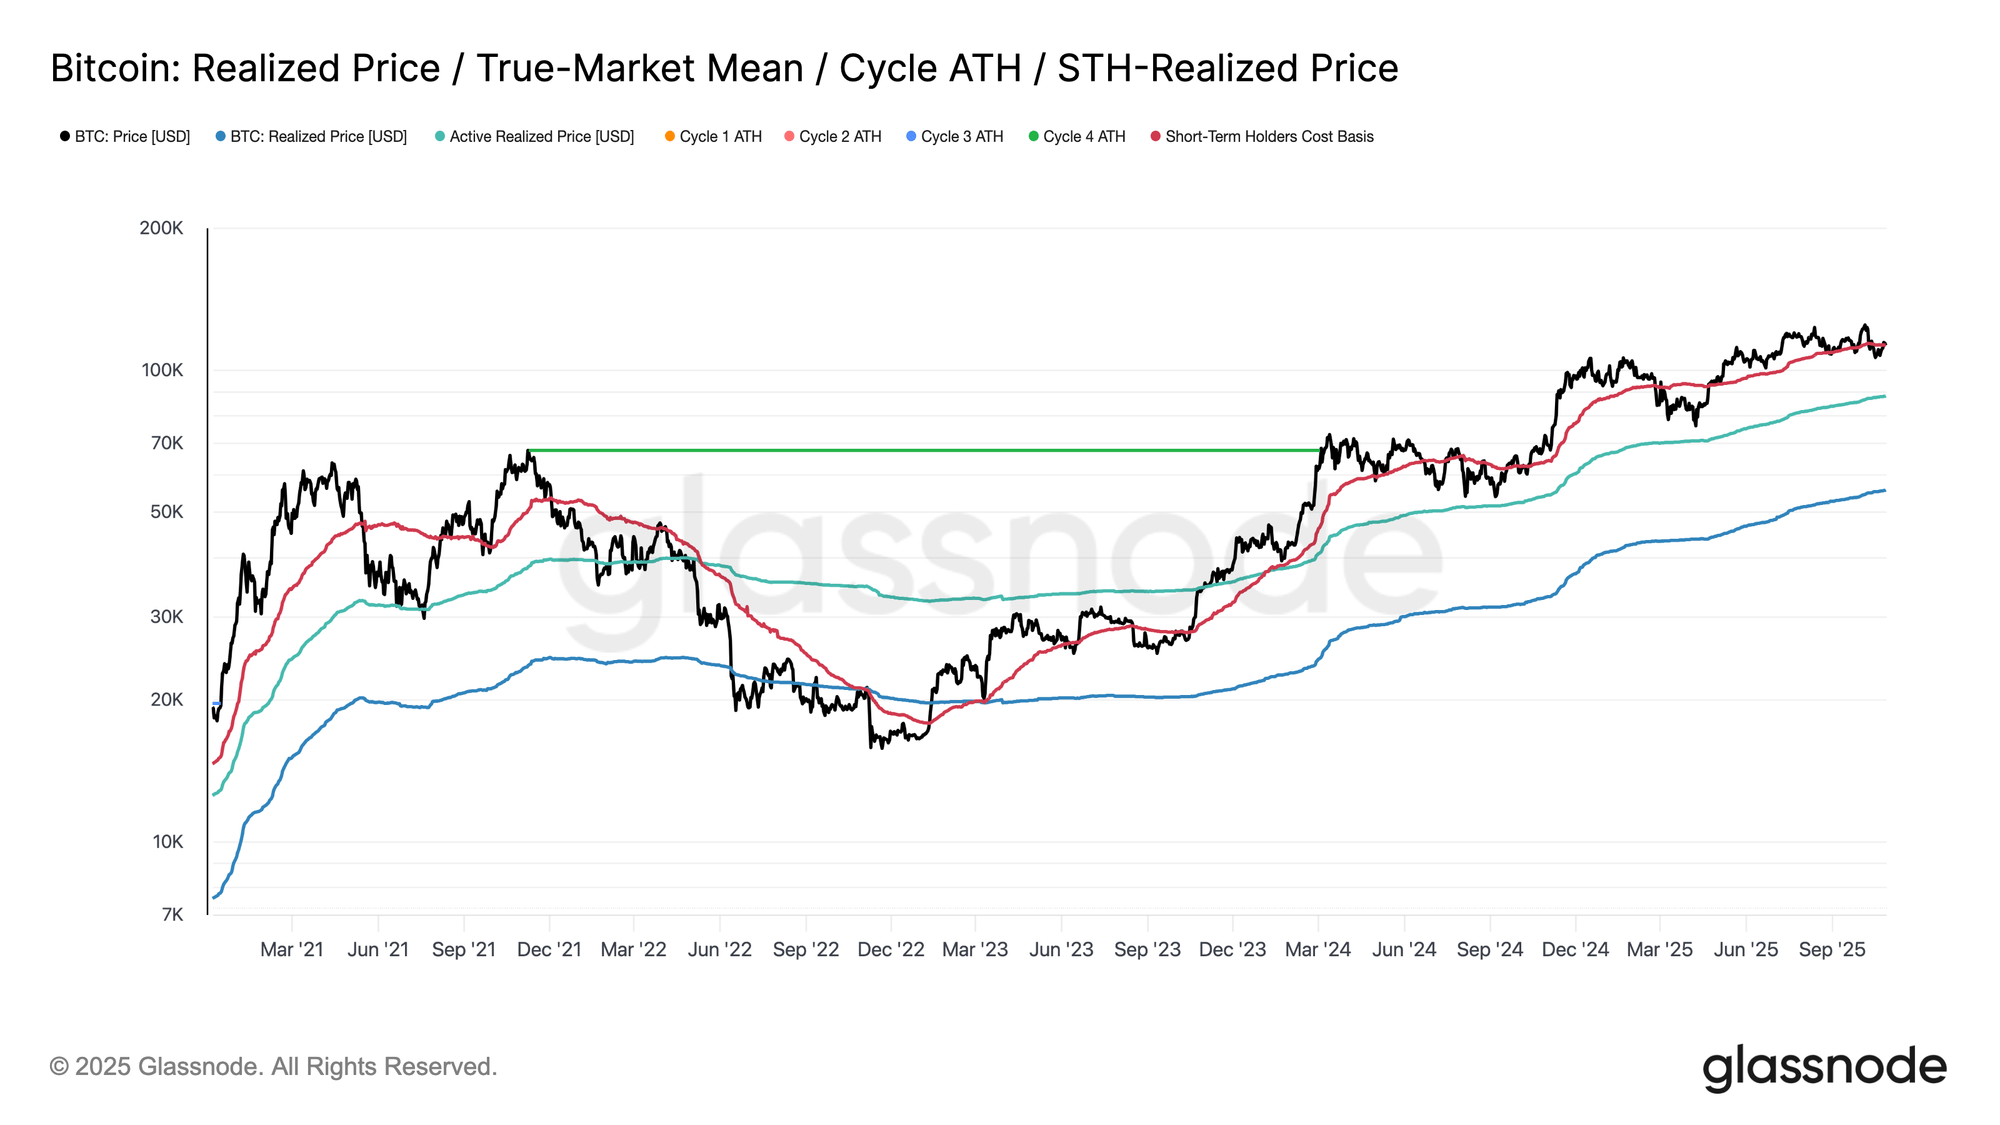
Bitcoin has struggled to reclaim the short-term holder Realized Price, a key on-chain level. Here’s ...

Forget Cardano, Why Shiba Inu’s Shibarium Is The Real Ghost Chain
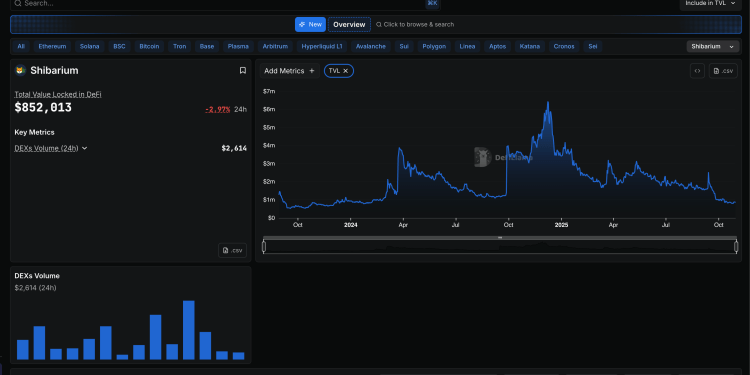
Shiba Inu’s effort to grow beyond being a meme coin is struggling. Its blockchain network, Shibarium...

